อ่าน 126 นาที
เศรษฐกิจของสหรัฐอเมริกา
สหรัฐอเมริกามีเศรษฐกิจ แบบตลาด ที่มีการพัฒนา และหลากหลาย สูง [ 38 ] [ 39 ] เป็น เศรษฐกิจที่ใหญ่ที่สุดในโลกเมื่อพิจารณาจาก GDP ตามมูลค่าที่แท้จริง โดย สร้างผลผลิตทางเศรษฐกิจโลกถึง...
เศรษฐกิจของสหรัฐอเมริกา
 นครนิวยอร์ก ซึ่งเป็นเมืองที่ใหญ่ที่สุดของประเทศ ถือเป็น ศูนย์กลางทางการเงินและเศรษฐกิจมหานครหลักของโลก[ 1 ] [ 2 ] | |||||
| สกุลเงิน | ดอลลาร์สหรัฐ (USD, $) | ||||
|---|---|---|---|---|---|
| 1 ตุลาคม – 30 กันยายน | |||||
องค์กรการค้า | WTO , G20 , G7 , OECD , USMCA , APECและอื่นๆ | ||||
กลุ่มประเทศ | |||||
| สถิติ | |||||
| ประชากร | |||||
| จีดีพี |
| ||||
| อันดับ GDP | |||||
ผลิตภัณฑ์มวลรวมภายในประเทศต่อหัว | |||||
อันดับ GDP ต่อหัว | |||||
| 1.8% (2024) [ 7 ] | |||||
ผลิตภัณฑ์มวลรวมภายในประเทศ (GDP) แยกตามภาคส่วน |
| ||||
ผลิตภัณฑ์มวลรวมภายในประเทศ (GDP) แยกตามองค์ประกอบ |
| ||||
ประชากรที่อยู่ต่ำกว่า เส้นความยากจนระดับชาติ | |||||
| |||||
กำลังแรงงาน | |||||
กำลังแรงงานจำแนกตามอาชีพ |
| ||||
เงินเดือนเฉลี่ยก่อนหักภาษี | 6,126 ดอลลาร์ต่อเดือน[ 19 ] (2025) | ||||
| 4,637 ดอลลาร์ต่อเดือน[ 19 ] (2025) | |||||
| 72.07 ดอลลาร์ต่อวัน (2024) [ 20 ] | |||||
| 0.8% (รายชั่วโมง, 2025) [ 21 ] | |||||
ค่าใช้จ่ายในการบริโภคขั้นสุดท้าย | |||||
การก่อตัวของทุนขั้นต้น | |||||
| พันธบัตรอายุ 10 ปี อัตราดอกเบี้ย 4.28% (เมษายน 2568) [ 22 ] | |||||
อุตสาหกรรมหลัก | |||||
| |||||
| ภายนอก | |||||
| การส่งออก | |||||
สินค้าส่งออก |
| ||||
คู่ค้าส่งออกหลัก |
| ||||
| การนำเข้า | |||||
นำเข้าสินค้า |
| ||||
พันธมิตรนำเข้าหลัก | |||||
หุ้นFDI | |||||
| การเงินสาธารณะ | |||||
| |||||
| 250 พันล้านดอลลาร์ (2024) [ 32 ] | |||||
| 8.720 ล้านล้านดอลลาร์สหรัฐ[ 31 ] 29.9% ของ GDP (2024) | |||||
| 10.945 ล้านล้านดอลลาร์สหรัฐ[ 31 ] 37.5% ของ GDP (2024) การใช้จ่ายของรัฐบาลสหรัฐ | |||||
| ความช่วยเหลือทางเศรษฐกิจ | ผู้บริจาค : ODA , 35.26 พันล้านดอลลาร์ (2017) [ 34 ] | ||||
ราคาทั้งหมด ยกเว้นที่ระบุไว้เป็นอย่างอื่น เป็น สกุลเงิน ดอลลาร์สหรัฐ | |||||
| บทความนี้เป็นส่วนหนึ่งของชุดบทความเกี่ยวกับ |
| เศรษฐกิจของสหรัฐอเมริกา |
|---|
 |
|
สหรัฐอเมริกามีเศรษฐกิจแบบตลาด ที่มีการพัฒนา และหลากหลายสูง[ 38 ] [ 39 ]เป็นเศรษฐกิจที่ใหญ่ที่สุดในโลกเมื่อพิจารณาจาก GDP ตามมูลค่าที่แท้จริงโดยสร้างผลผลิตทางเศรษฐกิจโลกถึง 26% [ 40 ] [ 41 ]และเป็น ประเทศที่มีเศรษฐกิจใหญ่ เป็นอันดับสองเมื่อพิจารณาจากอำนาจซื้อ (PPP) เมื่อพิจารณาต่อหัว สหรัฐอเมริกามีGDP ต่อหัวตามมูลค่าที่แท้จริงสูงเป็นอันดับเก้าและGDP ต่อหัวตาม PPP สูงเป็นอันดับสิบ [ 6 ] [ 42 ] เงินดอลลาร์สหรัฐ เป็น สกุลเงินสำรองที่สำคัญที่สุดของโลกมีการใช้งานอย่างแพร่หลายในระดับสากลและใช้เป็นมาตรฐานอ้างอิงสำหรับเงินปิโตรดอลลาร์และเงินยูโรดอลลาร์ [ 43 ] นับตั้งแต่สิ้นสุดสงครามโลกครั้งที่สองเศรษฐกิจมีการเติบโตที่ค่อนข้างคงที่อัตราการว่างงานและอัตราเงินเฟ้อต่ำพร้อมกับความก้าวหน้าอย่างรวดเร็วในด้านเทคโนโลยีเศรษฐกิจของอเมริกาได้รับแรงขับเคลื่อนจากผลิตภาพ สูง โครงสร้างพื้นฐานด้านการขนส่งที่พัฒนาอย่างดีและทรัพยากรธรรมชาติที่ อุดมสมบูรณ์ [ 44 ]
ประเทศนี้เป็นผู้ผลิตรายใหญ่เป็นอันดับสองโดยการผลิตของอเมริกาคิดเป็นหนึ่งในห้าของการผลิตทั่วโลก[ 45 ] คู่ค้าที่ใหญ่ที่สุดของสหรัฐฯ ได้แก่ เม็กซิโก แคนาดา จีน ญี่ปุ่น และเยอรมนี [ 46 ] สหรัฐฯเป็นผู้นำเข้ารายใหญ่ที่สุดของโลกและเป็นผู้ส่งออกรายใหญ่เป็นอันดับสอง [ 47 ]สหรัฐฯมีข้อตกลงการค้าเสรีกับหลายประเทศ [ 48 ] ประเทศ นี้เป็นผู้ผลิต ปิโตรเลียมก๊าซธรรมชาติและผลิตภัณฑ์เลือดรายใหญ่ที่สุดของโลก[ 49 ] [ 50 ]สหรัฐฯ มีตลาดผู้บริโภค ที่ใหญ่ที่สุด ใน โลก [ 51 ]ภายในระบบธนาคารของอเมริกา ณ ปี 2026 ธนาคารพาณิชย์มีสินทรัพย์ 25 ล้านล้านดอลลาร์[ 52 ]ประเทศนี้มีตลาดพันธบัตรของรัฐบาลสหรัฐฯ ขนาดใหญ่และเป็น ที่ตั้งของ แหล่งสำรองทองคำที่ใหญ่ที่สุดในโลก[ 53 ]เป็นที่ตั้งของบริษัทขนาดใหญ่ที่สุด 139 แห่งจาก 500 แห่งทั่วโลก [ 54 ]
ชาวอเมริกันมีรายได้ ครัวเรือนและ รายได้ พนักงานเฉลี่ยสูงเป็นอันดับ 6 ในกลุ่มประเทศสมาชิกOECD [ 55 ]ในปี 2026 พวกเขามีรายได้ครัวเรือนเฉลี่ย สูงที่สุด ในบรรดาประเทศ OECD [ 56 ] และมี ความเหลื่อมล้ำทางรายได้สูงที่สุดแห่งหนึ่งในกลุ่มประเทศพัฒนาแล้ว [ 57 ] [ 58 ] สหรัฐอเมริกามีจำนวนมหาเศรษฐีมากที่สุด ในโลก โดยมีทรัพย์สินรวม 5.7 ล้านล้าน ดอลลาร์ [ 59 ]สหรัฐอเมริกามีตลาดแรงงาน ที่มีความยืดหยุ่นสูง และความมั่นคงในงานค่อนข้างต่ำ[ 60 ] [ 61 ]ตลาดแรงงานของประเทศดึงดูดผู้อพยพจากทั่วโลกและอัตราการย้ายถิ่นฐานสุทธิอยู่ในระดับสูงที่สุดในโลก[ 62 ]สหรัฐอเมริกามีระบบประกันสังคม ที่มีประสิทธิภาพสูง โดยค่าใช้จ่ายด้านสังคมอยู่ที่ประมาณ 30% ของ GDP [ 63 ] [ 64 ]
ตลาดหลักทรัพย์นิวยอร์กและแนสแด็ก เป็น ตลาดหลักทรัพย์ที่ใหญ่ที่สุดในโลกเมื่อพิจารณาจากมูลค่าตลาดและปริมาณการทำธุรกรรม[ 65 ] [ 66 ]ตลาดทุนของสหรัฐฯ มีขนาดใหญ่มาก โดยมีมูลค่ารวมของกิจกรรมด้านหุ้นและพันธบัตรทั่วโลกเกิน 134.7 ล้านล้านดอลลาร์[ 67 ]สหรัฐฯ ยังได้รับการจัดอันดับสูงในด้านเงินทุนร่วมลงทุนระดับ โลก รวมถึง การวิจัยและพัฒนา [ 68 ] [ 69 ] ตั้งแต่ปี 2023 เป็นต้นมา สหรัฐฯ ใช้จ่ายประมาณ 3.46% ของ GDPในการวิจัยและพัฒนาที่ล้ำสมัยในภาคส่วนต่างๆ ของเศรษฐกิจ[ 70 ]ตั้งแต่ทศวรรษ 1990 การใช้จ่ายของผู้บริโภคคิดเป็นสัดส่วนมากกว่า 60% ถึง 70% ของเศรษฐกิจสหรัฐฯ[ 71 ] [ 72 ]สหรัฐฯ เป็นหนึ่งในประเทศที่มีผลการดำเนินงานดีที่สุดในด้านดัชนีความสะดวกในการทำธุรกิจและ ความสามารถ ในการแข่งขันระดับโลก [ 73 ]
ประวัติศาสตร์
ยุคอาณานิคมและศตวรรษที่ 18
ประวัติศาสตร์เศรษฐกิจของสหรัฐอเมริกาเริ่มต้นด้วยการตั้งถิ่นฐานของชาวอังกฤษตามแนวชายฝั่งตะวันออกในศตวรรษที่ 17 และ 18 หลังจากปี 1700 สหรัฐอเมริกามีประชากรเพิ่มขึ้นอย่างรวดเร็ว และการนำเข้าและการส่งออกก็เติบโตไปพร้อมกันแอฟริกาเอเชียและโดยเฉพาะอย่างยิ่งยุโรปมีส่วนร่วมในการค้าของอาณานิคม[ 74 ]อาณานิคมทั้ง 13 แห่งนี้ได้รับเอกราชจากจักรวรรดิอังกฤษในช่วงปลายศตวรรษที่ 18 [ 75 ] และเติบโตอย่างรวดเร็วจากเศรษฐกิจอาณานิคมไปสู่เศรษฐกิจที่เน้นการเกษตร [ 76 ]
ศตวรรษที่ 19

ในระยะเวลา 180 ปี สหรัฐอเมริกาเติบโตขึ้นเป็นเศรษฐกิจขนาดใหญ่ที่บูรณาการและเป็นอุตสาหกรรมซึ่งคิดเป็นประมาณหนึ่งในห้าของเศรษฐกิจโลกในกระบวนการนั้น GDP ต่อหัวของสหรัฐฯ เพิ่มสูงขึ้นแซงหน้าหลายประเทศ และแซงหน้าจักรวรรดิอังกฤษ ขึ้น มาเป็นอันดับหนึ่ง เศรษฐกิจยังคงรักษาระดับค่าจ้างสูง ดึงดูดผู้อพยพนับล้านจากทั่วโลก[ 77 ]ในช่วงทศวรรษ 1820 และ 1830 การผลิตจำนวนมากทำให้เศรษฐกิจส่วนใหญ่เปลี่ยนจากช่างฝีมือไปสู่โรงงาน กฎระเบียบของรัฐบาลใหม่ทำให้สิทธิบัตรมีความเข้มแข็งขึ้น
ในช่วงต้นศตวรรษที่ 19 ชาวอเมริกันมากกว่า 80 เปอร์เซ็นต์ประกอบอาชีพเกษตรกรรม การผลิตส่วนใหญ่มุ่งเน้นไปที่ขั้นตอนแรกของการแปรรูปวัตถุดิบ โดยมีอุตสาหกรรมไม้แปรรูปและโรงเลื่อย สิ่งทอ และรองเท้าเป็นผู้นำ ทรัพยากรธรรมชาติที่อุดมสมบูรณ์มีส่วนช่วยให้เศรษฐกิจขยายตัวอย่างรวดเร็วในศตวรรษที่ 19 ที่ดินที่อุดมสมบูรณ์ทำให้จำนวนเกษตรกรเพิ่มขึ้นอย่างต่อเนื่อง แต่กิจกรรมในภาคการผลิต บริการ การขนส่ง และภาคส่วนอื่นๆ เติบโตเร็วกว่ามาก ดังนั้นในปี 1860 ประชากรในชนบทจึงเหลือเพียงประมาณ 50 เปอร์เซ็นต์ ลดลงจากกว่า 80 เปอร์เซ็นต์[ 78 ]
ในศตวรรษที่ 19 ภาวะเศรษฐกิจถดถอยมักเกิดขึ้นพร้อมกับวิกฤตการณ์ทางการเงินวิกฤตการณ์ ทางการเงินใน ปี 1837ตามมาด้วยภาวะเศรษฐกิจตกต่ำเป็นเวลาห้าปี ซึ่งมีลักษณะเด่นคือการล้มเหลวของธนาคารและการว่างงานที่ไม่ธรรมดา[ 79 ]เนื่องจากการเปลี่ยนแปลงครั้งใหญ่ในระบบเศรษฐกิจตลอดหลายศตวรรษ จึงเป็นการยากที่จะเปรียบเทียบความรุนแรงของภาวะเศรษฐกิจถดถอยในยุคปัจจุบันกับภาวะเศรษฐกิจถดถอยในยุคแรกๆ[ 80 ]ภาวะเศรษฐกิจถดถอยหลังสงครามโลกครั้งที่สองดูเหมือนจะรุนแรงน้อยกว่าภาวะเศรษฐกิจถดถอยในยุคก่อนๆ แต่เหตุผลสำหรับเรื่องนี้ยังไม่ชัดเจน[ 81 ]
ศตวรรษที่ 20


ในช่วงต้นศตวรรษนวัตกรรม ใหม่ และการปรับปรุงนวัตกรรมที่มีอยู่ได้เปิดประตูสู่การพัฒนามาตรฐานการครองชีพของผู้บริโภคชาวอเมริกัน บริษัทหลายแห่งเติบโตขึ้นอย่างมากโดยใช้ประโยชน์จากเศรษฐกิจขนาดใหญ่และการสื่อสารที่ดีขึ้นเพื่อดำเนินงานทั่วประเทศ การรวมตัวกันในอุตสาหกรรมเหล่านี้ทำให้เกิดความกังวลเกี่ยวกับการผูกขาดที่จะผลักดันราคาให้สูงขึ้นและผลผลิตลดลง แต่บริษัทเหล่านี้หลายแห่งลดต้นทุนอย่างรวดเร็วจนแนวโน้มเป็นไปในทิศทางของราคาที่ต่ำลงและผลผลิตที่เพิ่มขึ้นในอุตสาหกรรมเหล่านี้ คนงานจำนวนมากได้รับส่วนแบ่งความสำเร็จจากบริษัทขนาดใหญ่เหล่านี้ ซึ่งโดยทั่วไปแล้วเสนอค่าจ้างที่สูงที่สุดในโลก[ 82 ]
สหรัฐอเมริกาเป็นประเทศที่มีเศรษฐกิจใหญ่ที่สุดในโลกมาตั้งแต่ราวปี 1890 โดยแซงหน้าสหราชอาณาจักรในแง่ของ GDP ในปี 1872 และ GDP ต่อหัวในปี 1905 โดยปรับตามอำนาจซื้อ (PPP) [ 83 ]เป็นเวลาหลายปีหลังจากภาวะเศรษฐกิจตกต่ำครั้งใหญ่ในทศวรรษ 1930 เมื่ออันตรายจากภาวะเศรษฐกิจถดถอยดูร้ายแรงที่สุด รัฐบาลได้เสริมสร้างเศรษฐกิจโดยการใช้จ่ายอย่างหนักของตนเองหรือลดภาษีเพื่อให้ผู้บริโภคใช้จ่ายมากขึ้น และโดยการส่งเสริมการเติบโตอย่างรวดเร็วของปริมาณเงิน ซึ่งกระตุ้นให้มีการใช้จ่ายมากขึ้นเช่นกัน แนวคิดเกี่ยวกับเครื่องมือที่ดีที่สุดสำหรับการรักษาเสถียรภาพทางเศรษฐกิจเปลี่ยนแปลงไปอย่างมากระหว่างทศวรรษ 1930 และทศวรรษ 1980 ตั้งแต่ ยุค New Dealที่เริ่มต้นในปี 1933 ไปจนถึง โครงการ Great Societyในทศวรรษ 1960 ผู้กำหนดนโยบายระดับชาติพึ่งพานโยบายการคลัง เป็นหลัก ในการมีอิทธิพลต่อเศรษฐกิจ[ 84 ]
ในช่วงสงครามโลกครั้งที่ 2 ในศตวรรษที่ 20 สหรัฐอเมริกามีสถานการณ์ที่ดีกว่าประเทศคู่สงครามอื่นๆ เนื่องจากไม่มีการสู้รบใดๆ ในสงครามโลกครั้งที่ 1และสงครามโลกครั้งที่ 2เกิดขึ้นบนดินแดนอเมริกา และไม่มีการสู้รบในรัฐใดๆ ใน 48 รัฐที่อยู่ติดกัน อย่างไรก็ตาม แม้แต่ในสหรัฐอเมริกา สงครามก็หมายถึงการเสียสละ ในช่วงที่สงครามโลกครั้งที่ 2 ดำเนินไปอย่างเข้มข้น เกือบ 40 เปอร์เซ็นต์ของ GDP ของสหรัฐฯ ถูกใช้ไปกับการผลิตเพื่อสงคราม การตัดสินใจเกี่ยวกับเศรษฐกิจในวงกว้างส่วนใหญ่ทำไปเพื่อวัตถุประสงค์ทางทหาร และปัจจัยการผลิตที่เกี่ยวข้องเกือบทั้งหมดถูกจัดสรรให้กับการทำสงคราม สินค้าหลายอย่างถูกปันส่วน ราคาและค่าจ้างถูกควบคุม และสินค้าอุปโภคบริโภคที่ทนทานหลายอย่างก็หยุดการผลิต แรงงานจำนวนมากถูกเกณฑ์เข้ากองทัพและได้รับค่าจ้างเพียงครึ่งหนึ่ง ประมาณครึ่งหนึ่งของคนเหล่านั้นถูกส่งไปเผชิญอันตราย[ 85 ]
แนวทางที่เสนอโดยจอห์น เมย์นาร์ด เคนส์ นักเศรษฐศาสตร์ชาวอังกฤษ ทำให้เจ้าหน้าที่ที่ได้รับการเลือกตั้งมีบทบาทนำในการชี้นำเศรษฐกิจ เนื่องจากการใช้จ่ายและภาษีอยู่ภายใต้การควบคุมของประธานาธิบดีและรัฐสภา สหรัฐฯ “เบบี้บูม”ประสบกับการเพิ่มขึ้นอย่างมากของอัตราการเกิดในช่วงปี 1942–1957 ซึ่งเกิดจากการแต่งงานและการมีบุตรที่ล่าช้าในช่วงภาวะเศรษฐกิจตกต่ำ ความมั่งคั่งที่เพิ่มสูงขึ้น ความต้องการบ้านเดี่ยวในชานเมือง (ตรงข้ามกับอพาร์ตเมนต์ในใจกลางเมือง) และการมองโลกในแง่ดีเกี่ยวกับอนาคต บูมถึงจุดสูงสุดประมาณปี 1957 แล้วจึงเริ่มจางหายไป[ 86 ]ช่วงเวลาที่มีอัตราเงินเฟ้อ อัตราดอกเบี้ย และการว่างงานสูงหลังจากปี 1973 ทำให้ความเชื่อมั่นในนโยบายการคลังในฐานะเครื่องมือในการควบคุมอัตราการดำเนินกิจกรรมทางเศรษฐกิจโดยรวมลดลง[ 87 ]
เศรษฐกิจของสหรัฐอเมริกาเติบโตโดยเฉลี่ย 3.8% ตั้งแต่ปีพ.ศ. 2489 ถึง พ.ศ. 2516 ในขณะที่รายได้ครัวเรือนเฉลี่ย ที่แท้จริง เพิ่มขึ้น 74% (หรือ 2.1% ต่อปี) [ 88 ] [ 89 ]
นับตั้งแต่ทศวรรษ 1970 ประเทศกำลังพัฒนา หลายประเทศ เริ่มลดช่องว่างทางเศรษฐกิจกับสหรัฐอเมริกา ในกรณีส่วนใหญ่ เป็นผลมาจากการย้ายการผลิตสินค้าที่เคยผลิตในสหรัฐอเมริกาไปยังประเทศที่สามารถผลิตได้ในราคาที่ต่ำกว่าเพียงพอที่จะครอบคลุมค่าขนส่งบวกกับกำไรที่สูงขึ้น ในบางกรณี บางประเทศค่อยๆ เรียนรู้ที่จะผลิตสินค้าและบริการแบบเดียวกันกับที่ก่อนหน้านี้มีเพียงสหรัฐอเมริกาและอีกไม่กี่ประเทศเท่านั้นที่สามารถผลิตได้การเติบโตของรายได้ ที่แท้จริง ในสหรัฐอเมริกาชะลอตัวลง ในช่วงทศวรรษ 1970 และ 1980 เป็นที่นิยมในสหรัฐอเมริกาที่จะเชื่อว่าเศรษฐกิจของญี่ปุ่นจะแซงหน้าสหรัฐอเมริกา แต่สิ่งนี้ไม่ได้เกิดขึ้น[ 90 ]
ศตวรรษที่ 21

เศรษฐกิจของสหรัฐอเมริกาประสบภาวะถดถอยในปี 2544โดยมีการฟื้นตัวของการจ้างงานที่ช้าผิดปกติ โดยจำนวนงานไม่กลับไปสู่ระดับเดือนกุมภาพันธ์ 2544 จนกระทั่งเดือนมกราคม 2548 [ 91 ] “การฟื้นตัวที่ปราศจากการจ้างงาน” นี้เกิดขึ้นพร้อมกับการก่อตัวของฟองสบู่อสังหาริมทรัพย์และอาจกล่าวได้ว่าเป็นฟองสบู่หนี้ที่กว้างขึ้น เนื่องจากอัตราส่วนหนี้ครัวเรือนต่อ GDP เพิ่มขึ้นจากระดับสูงสุดเป็นประวัติการณ์ที่ 70% ในไตรมาสที่ 1 ปี 2544 เป็น 99% ในไตรมาสที่ 1 ปี 2551 เจ้าของบ้านกู้ยืมเงินโดยใช้บ้านที่มีราคาสูงเกินจริงเป็นหลักประกันเพื่อกระตุ้นการบริโภค ทำให้ระดับหนี้ของพวกเขาสูงขึ้น ในขณะเดียวกันก็เป็นการกระตุ้น GDP ที่ไม่ยั่งยืน เมื่อราคาบ้านเริ่มลดลงในปี 2549 มูลค่าของหลักทรัพย์ที่ค้ำประกันโดยการจำนองก็ลดลงอย่างมาก ทำให้เกิดสถานการณ์ที่เทียบเท่ากับการแห่ถอนเงินใน ระบบธนาคารที่ ไม่ใช่ธนาคารรับฝากเงิน ซึ่งโดยพื้นฐานแล้วไม่ได้รับการควบคุม ซึ่งเติบโตเกินกว่า ระบบธนาคารรับฝากเงินแบบดั้งเดิมที่ได้รับการควบคุมบริษัทจำนองหลายแห่งและธนาคารที่ไม่ใช่ธนาคารรับฝากเงินอื่นๆ (เช่นธนาคารเพื่อการลงทุน ) เผชิญกับวิกฤตที่เลวร้ายลงในปี 2550–2551 โดยวิกฤตการณ์ธนาคารถึงจุดสูงสุดในเดือนกันยายน 2551ด้วยการล้มละลายของLehman Brothersและการช่วยเหลือสถาบันการเงินอื่นๆ อีกหลายแห่ง[ 92 ]
รัฐบาลบุช (2001–2009) และรัฐบาลโอบามา (2009–2017) ได้ใช้มาตรการช่วยเหลือ ธนาคาร และมาตรการกระตุ้น เศรษฐกิจ แบบเคนส์ ผ่านการขาดดุลของรัฐบาลที่สูง ในขณะที่ธนาคารกลางสหรัฐยังคงอัตราดอกเบี้ยไว้ที่ระดับใกล้ศูนย์ มาตรการเหล่านี้ช่วยให้เศรษฐกิจฟื้นตัว เนื่องจากครัวเรือนชำระหนี้ในช่วงปี 2009–2012 ซึ่งเป็นเพียงปีเดียวตั้งแต่ปี 1947 ที่เกิดเหตุการณ์เช่นนี้[ 93 ]ซึ่งเป็นอุปสรรคสำคัญต่อการฟื้นตัว[ 92 ] GDP ที่แท้จริงกลับคืนสู่ระดับสูงสุดก่อนวิกฤต (ปลายปี 2550) ภายในปี 2554 [ 94 ]มูลค่าสุทธิของครัวเรือนภายในไตรมาสที่ 2 ของปี 2555 [ 95 ]จำนวนงานนอกภาคเกษตรกรรมภายในเดือนพฤษภาคม 2557 [ 91 ]และอัตราการว่างงานภายในเดือนกันยายน 2558 [ 96 ]ตัวแปรเหล่านี้แต่ละตัวยังคงเพิ่มขึ้นอย่างต่อเนื่องจนถึงระดับสูงสุดหลังภาวะเศรษฐกิจถดถอยตามวันที่กล่าวมา โดยการฟื้นตัวของสหรัฐฯ กลายเป็นช่วงที่ยาวนานที่สุดเป็นอันดับสองในประวัติศาสตร์ในเดือนเมษายน 2561 [ 97 ]
ภาวะเศรษฐกิจ ถดถอยครั้งใหญ่เกิดขึ้นในช่วงวิกฤตการณ์ทางการเงินปี 2551เมื่อ GDP ลดลง 5.0% ตั้งแต่ฤดูใบไม้ผลิปี 2551 ถึงฤดูใบไม้ผลิปี 2552 ภาวะเศรษฐกิจถดถอยครั้งสำคัญอื่นๆ เกิดขึ้นในปี 1957–1958 เมื่อ GDP ลดลง 3.7% หลังวิกฤตการณ์น้ำมันในปี 1973โดยลดลง 3.1% ตั้งแต่ปลายปี 1973 ถึงต้นปี 1975 และในภาวะเศรษฐกิจถดถอยปี 1981–1982 เมื่อ GDP ลดลง 2.9% [ 98 ] [ 99 ]ภาวะเศรษฐกิจถดถอยที่ไม่รุนแรงในช่วงไม่นานมานี้ ได้แก่ ภาวะเศรษฐกิจตกต่ำปี 1990–1991 เมื่อผลผลิตลดลง 1.3% และภาวะเศรษฐกิจถดถอยปี 2001 ซึ่ง GDP ลดลง 0.3% ภาวะเศรษฐกิจตกต่ำปี 2001 กินเวลาเพียงแปดเดือน[ 99 ]ในทางกลับกัน ช่วงเวลาการเติบโตที่แข็งแกร่งและต่อเนื่องที่สุดเกิดขึ้นตั้งแต่ต้นปี 1961 ถึงกลางปี 1969 โดยมีการขยายตัว 53% (5.1% ต่อปี) ตั้งแต่กลางปี 1991 ถึงปลายปี 2000 ที่ 43% (3.8% ต่อปี) และตั้งแต่ปลายปี 1982 ถึงกลางปี 1990 ที่ 37% (4% ต่อปี) [ 98 ]
หนี้สาธารณะ ซึ่งเป็นมาตรวัดหนี้สาธารณะของประเทศเพิ่มขึ้นตลอดศตวรรษที่ 21 โดยเพิ่มขึ้นจาก 31% ในปี 2000 เป็น 52% ในปี 2009 แตะระดับ 77% ของ GDP ในปี 2017 และเกิน 120% ในปี 2024 ทำให้สหรัฐอเมริกาอยู่ในอันดับที่ 43 ของประเทศที่มีหนี้สูงที่สุดจากทั้งหมด 207 ประเทศ[ 100 ]
การระบาดใหญ่ของโควิด 19
ในช่วงสองไตรมาสแรกของปี 2020 ท่ามกลางการดำรงตำแหน่งประธานาธิบดีของโดนัลด์ ทรัมป์[ 101 ]เศรษฐกิจสหรัฐฯ ประสบกับความถดถอยครั้งใหญ่ตั้งแต่เดือนมีนาคม 2020 อันเนื่องมาจากไวรัสโคโรนาสายพันธุ์ใหม่และการต้อง "ปิดตัว" ภาคส่วนสำคัญของเศรษฐกิจอเมริกัน[ 102 ]ณ เดือนมีนาคม 2020 การส่งออกรถยนต์และเครื่องจักรกลอุตสาหกรรมของสหรัฐฯ ลดลงอย่างมากอันเป็นผลมาจากการระบาดใหญ่ทั่วโลก[ 103 ] มาตรการ เว้นระยะห่างทางสังคมซึ่งมีผลบังคับใช้ในเดือนมีนาคม 2020 และส่งผลกระทบในเชิงลบต่อความต้องการสินค้าและบริการ ส่งผลให้GDP ของสหรัฐฯ ลดลงในอัตรา 4.8% ต่อปีในไตรมาสแรก ซึ่งเป็นอัตราการหดตัวของผลผลิตที่รุนแรงที่สุดนับตั้งแต่ไตรมาสที่สี่ของปี 2008 [ 104 ]ยอดขายปลีกของสหรัฐฯ ลดลงเป็นประวัติการณ์ถึง 8.7% ในเดือนมีนาคมเพียงเดือนเดียว อุตสาหกรรมการบินของสหรัฐฯ ก็ได้รับผลกระทบอย่างหนักเช่นกัน โดยมีรายได้ลดลงอย่างมาก[ 105 ]ภาวะเศรษฐกิจถดถอยจากโควิด-19ได้รับการอธิบายอย่างกว้างขวางว่าเป็นภาวะเศรษฐกิจตกต่ำทั่วโลกที่รุนแรงที่สุดนับตั้งแต่ภาวะเศรษฐกิจตกต่ำครั้งใหญ่และ "เลวร้ายกว่า" ภาวะเศรษฐกิจ ถดถอยครั้งใหญ่[ 106 ] [ 107 ] [ 108 ] [ 109 ]

ในเดือนพฤษภาคม 2020 CNNได้นำเสนอการวิเคราะห์โดยอิงจากข้อมูลการว่างงานว่าเศรษฐกิจสหรัฐฯ อาจอยู่ในภาวะที่ย่ำแย่ที่สุดนับตั้งแต่ทศวรรษ 1930 [ 111 ]ภายในวันที่ 8 พฤษภาคม สหรัฐฯ มีอัตราการว่างงานสูงถึง 14.7 เปอร์เซ็นต์ ซึ่งเป็นสถิติสูงสุด โดยมีงานหายไป 20.5 ล้านตำแหน่งในเดือนเมษายน[ 112 ]เจโรม พาวเวลล์ประธานธนาคารกลางสหรัฐฯเตือนว่าอาจต้องใช้เวลา "นาน" กว่าที่เศรษฐกิจสหรัฐฯ จะฟื้นตัวอย่างเต็มที่จากภาวะเศรษฐกิจที่อ่อนแออันเนื่องมาจากการระบาดใหญ่ และในอนาคตอันใกล้ สหรัฐฯ อาจคาดหวังได้ว่าจะมี "การเติบโตของผลิตภาพต่ำและรายได้ที่หยุดนิ่ง" [ 113 ]ภายในวันที่ 31 พฤษภาคม 2020 ชาวอเมริกันมากกว่า 40 ล้านคนได้ยื่นขอรับสวัสดิการว่างงาน[ 114 ]
ภายในเดือนมิถุนายน พ.ศ. 2563 เที่ยวบินภายในประเทศสหรัฐอเมริกาที่ลดลงเนื่องจากการระบาดของไวรัสโคโรนาส่งผลให้รัฐบาลสหรัฐฯ ต้องระงับการให้บริการของสายการบินสหรัฐฯ จำนวน 15 สายการบินไปยังสนามบินภายในประเทศ 75 แห่งเป็นการชั่วคราว[ 115 ]หนังสือพิมพ์นิวยอร์กไทมส์รายงานเมื่อวันที่ 10 มิถุนายน พ.ศ. 2563 ว่า "การขาดดุลงบประมาณของสหรัฐอเมริกาเพิ่มขึ้นเป็นสถิติสูงสุดที่ 1.88 ล้านล้านดอลลาร์ในช่วงแปดเดือนแรกของปีงบประมาณ นี้ " [ 116 ]
เศรษฐกิจสหรัฐฯ ฟื้นตัวจากการระบาดของโควิด-19 ในปี 2021 โดยเติบโตขึ้น 5.7% ซึ่งเป็นผลงานที่ดีที่สุดนับตั้งแต่สมัยประธานาธิบดีโรนัลด์ เรแกน (1981–1989) [ 117 ]
ปี 2021–2022 ถือเป็นปีที่มีอัตราเงินเฟ้อพุ่งสูงขึ้น เป็นประวัติการณ์ ในสหรัฐอเมริกา โดยดัชนีราคาผู้บริโภคพุ่งสูงถึง 9.1% ในเดือนมิถุนายน 2022 เมื่อเทียบกับเดือนมิถุนายน 2021 ซึ่งถือเป็นอัตราเงินเฟ้อสูงสุดในรอบ 41 ปี โดยนักวิจารณ์ต่างตำหนิธนาคารกลางสหรัฐฯและปัจจัยอื่นๆ[ 118 ]อัตราเงินเฟ้อแตะระดับ 4.9% ในเดือนเมษายน 2023 ซึ่งสูงกว่าเป้าหมาย 2% ของธนาคารกลางสหรัฐฯ ประมาณ 3% [ 119 ]
จากรายงานปี 2024 ที่จัดทำโดยสถาบัน Brookingsเศรษฐกิจอเมริกันฟื้นตัวได้ดีกว่าหลังเกิดการระบาดของ COVID-19 เมื่อเทียบกับภาวะเศรษฐกิจถดถอยครั้งใหญ่ และยังฟื้นตัวได้เร็วกว่าประเทศอื่นๆ ในกลุ่ม G10 อีกด้วย ในทางตรงกันข้าม ผู้นำทั้งพรรครีพับลิกันและพรรคเดโมแครตได้ให้การสนับสนุนทางการคลังอย่างที่ไม่เคยมีมาก่อนผ่านร่างกฎหมายบรรเทาผลกระทบในปี 2020 และ 2021 เพื่อรักษากิจกรรมทางเศรษฐกิจ นักวิจัยพบว่าการรักษาระดับเงินเดือนและการสนับสนุนโดยตรงแก่ครัวเรือนช่วยบรรเทาผลกระทบระยะยาวที่เกิดขึ้นหลังวิกฤตปี 2008 ได้มาก และการหยุดชะงักของห่วงโซ่อุปทานเป็นสาเหตุหลักของภาวะเงินเฟ้อที่เกิดขึ้น[ 120 ]
ภายในเดือนกันยายน พ.ศ. 2568 อัตราเงินเฟ้อลดลงเหลือ 2.9% แม้จะมีความกังวลว่านโยบายภาษีนำเข้าของประธานาธิบดีโดนัลด์ ทรัมป์จะทำให้ราคาสินค้าอุปโภคบริโภคพุ่งสูงขึ้นมากก็ตาม[ 121 ]
ในเดือนตุลาคม ผู้ว่าการธนาคารกลางสหรัฐหลายคนระบุว่าพวกเขายินดีที่จะลดอัตราดอกเบี้ยในช่วงที่เหลือของปี 2025 แม้ว่าอัตราเงินเฟ้อจะสูงกว่าเป้าหมาย 2% ของธนาคารกลางสหรัฐก็ตาม[ 122 ] [ 123 ]
ข้อมูล
ตารางต่อไปนี้แสดงตัวชี้วัดทางเศรษฐกิจหลักในช่วงปี พ.ศ. 2523–2567 (พร้อมการประมาณการของเจ้าหน้าที่ IMF ในช่วงปี พ.ศ. 2568–2562) อัตราเงินเฟ้อที่ต่ำกว่า 5% แสดงด้วยสีเขียว[ 124 ]
| ปี | ผลิตภัณฑ์มวลรวมภายในประเทศ ( GDP ) (หน่วยเป็นพันล้านดอลลาร์สหรัฐ ตามกำลังซื้อ) | ผลิตภัณฑ์มวลรวมภายในประเทศต่อหัว(ในสกุลเงินดอลลาร์สหรัฐฯ ตามกำลังซื้อ) | ผลิตภัณฑ์มวลรวมภายใน ประเทศ (GDP) (หน่วยเป็นพันล้านดอลลาร์สหรัฐ ตามมูลค่าที่แท้จริง) | ผลิตภัณฑ์มวลรวมภายในประเทศต่อหัว(ในสกุลเงินดอลลาร์สหรัฐฯ ตามราคาปัจจุบัน) | การเติบโตของ GDP (ที่แท้จริง) | อัตราเงินเฟ้อ(เป็นเปอร์เซ็นต์) | อัตราการว่างงาน(ร้อยละ) | หนี้สาธารณะ(คิดเป็นเปอร์เซ็นต์ของ GDP) |
|---|---|---|---|---|---|---|---|---|
| 1980 | 2,857.3 | 12,552.9 | 2,857.3 | 12,552.9 | 7.2% | ไม่มีข้อมูล | ||
| 1981 | ไม่มีข้อมูล | |||||||
| พ.ศ. 2525 | ไม่มีข้อมูล | |||||||
| พ.ศ. 2526 | ไม่มีข้อมูล | |||||||
| พ.ศ. 2527 | ไม่มีข้อมูล | |||||||
| พ.ศ. 2528 | ไม่มีข้อมูล | |||||||
| พ.ศ. 2529 | ไม่มีข้อมูล | |||||||
| พ.ศ. 2530 | ไม่มีข้อมูล | |||||||
| 1988 | ไม่มีข้อมูล | |||||||
| 1989 | ไม่มีข้อมูล | |||||||
| 1990 | ไม่มีข้อมูล | |||||||
| 1991 | ไม่มีข้อมูล | |||||||
| 1992 | ไม่มีข้อมูล | |||||||
| พ.ศ. 2536 | ไม่มีข้อมูล | |||||||
| พ.ศ. 2537 | ไม่มีข้อมูล | |||||||
| พ.ศ. 2538 | ไม่มีข้อมูล | |||||||
| พ.ศ. 2539 | ไม่มีข้อมูล | |||||||
| พ.ศ. 2540 | ไม่มีข้อมูล | |||||||
| 1998 | ไม่มีข้อมูล | |||||||
| 1999 | ไม่มีข้อมูล | |||||||
| 2000 | ไม่มีข้อมูล | |||||||
| 2001 | 53.1% | |||||||
| 2002 | ||||||||
| 2003 | ||||||||
| 2004 | ||||||||
| 2548 | ||||||||
| 2006 | ||||||||
| 2007 | ||||||||
| 2008 | ||||||||
| 2009 | ||||||||
| 2010 | ||||||||
| 2011 | ||||||||
| 2012 | ||||||||
| 2013 | ||||||||
| 2014 | ||||||||
| 2015 | ||||||||
| 2016 | ||||||||
| 2017 | ||||||||
| 2018 | ||||||||
| 2019 | ||||||||
| 2020 | ||||||||
| 2021 | ||||||||
| 2022 | ||||||||
| 2023 | ||||||||
| 2024 | ||||||||
| 2025 | ||||||||
| 2026 | ||||||||
| 2027 | ||||||||
| 2028 | ||||||||
| 2029 |

จีดีพี


GDP ตามราคาปัจจุบันของสหรัฐฯคาดการณ์ไว้ที่ 31.856 ล้านล้านดอลลาร์ในไตรมาสแรกของปี 2026 ซึ่งเป็นตัวเลขที่สูงที่สุดในโลก[ 126 ]เมื่อคำนวณเป็นรายปี GDP ตามราคาปัจจุบันแตะระดับ 20.1 ล้านล้านดอลลาร์ในไตรมาสแรกของปี 2018 ซึ่งเป็นครั้งแรกที่เกิน 20 ล้านล้านดอลลาร์ ประมาณ 70% ของ GDP ของสหรัฐฯ มาจากการบริโภคส่วนบุคคล การลงทุนทางธุรกิจ 18% ภาครัฐ 17% (รัฐบาลกลาง รัฐ และท้องถิ่น แต่ไม่รวมการโอนเงิน เช่น ประกันสังคม ซึ่งอยู่ในหมวดการบริโภค) และการส่งออกสุทธิติดลบ 3% เนื่องจากการขาดดุลการค้าของสหรัฐฯ[ 127 ]
ผลิตภัณฑ์มวลรวมภายในประเทศที่แท้จริง (Real GDP ) ซึ่งเป็นมาตรวัดทั้งการผลิตและรายได้ เติบโตขึ้น 2.3% ในปี 2017 เทียบกับ 1.5% ในปี 2016 และ 2.9% ในปี 2015 อัตราการเติบโตของ GDP ที่แท้จริงต่อไตรมาสอยู่ที่ 2.2% ในไตรมาสที่ 1 ปี 2018, 4.2% ในไตรมาสที่ 2 ปี 2018, 3.4% ในไตรมาสที่ 3 ปี 2018 และ 2.2% ในไตรมาสที่ 4 ปี 2018 โดยอัตราการเติบโตในไตรมาสที่ 2 เป็นอัตราการเติบโตที่ดีที่สุดนับตั้งแต่ไตรมาสที่ 3 ปี 2014 และการเติบโตของ GDP โดยรวมรายปีที่ 2.9% ในปี 2018 เป็นผลการดำเนินงานที่ดีที่สุดของเศรษฐกิจในรอบทศวรรษ[ 128 ]ในปี 2020 อัตราการเติบโตของ GDP เริ่มลดลงอันเป็นผลมาจากการระบาดของ COVID-19ส่งผลให้ GDP หดตัวลงที่อัตราการเติบโตรายปีรายไตรมาสที่ −5.0% ในไตรมาสที่ 1 ปี 2020 และ −32.9% ในไตรมาสที่ 2 ปี 2020 ตามลำดับ
ในปี 2014 จีนแซงหน้าสหรัฐอเมริกาขึ้นเป็นประเทศที่มีเศรษฐกิจใหญ่ที่สุดเมื่อพิจารณาจาก GDP (PPP) โดยวัดจากอัตราการแปลงอำนาจซื้อ สหรัฐอเมริกามีตัวเลข GDP (PPP) สูงที่สุดมานานกว่าหนึ่งศตวรรษก่อนที่จะถึงจุดสำคัญนี้ จีนมีอัตราการเติบโตมากกว่าสหรัฐอเมริกาถึงสามเท่าในแต่ละปีตลอด 40 ปีที่ผ่านมา ในปี 2017 สหภาพยุโรปโดยรวมมี GDP ใหญ่กว่าสหรัฐอเมริกาประมาณ 5% แม้ว่าสหภาพยุโรปจะเป็นเพียงสหภาพทางการเมืองไม่ใช่ประเทศก็ตาม อย่างไรก็ตาม สหรัฐอเมริกายังคงเป็นประเทศที่มีเศรษฐกิจใหญ่ที่สุดในโลกด้วย GDP ที่เป็นตัวเลขสูงสุด[ 129 ]
ผลิตภัณฑ์มวลรวมภายในประเทศที่แท้จริงต่อหัว (วัดเป็นดอลลาร์ปี 2009) อยู่ที่ 52,444 ดอลลาร์ในปี 2017 และเติบโตขึ้นทุกปีนับตั้งแต่ปี 2010 โดยเติบโตเฉลี่ย 3.0% ต่อปีในช่วงทศวรรษ 1960, 2.1% ในช่วงทศวรรษ 1970, 2.4% ในช่วงทศวรรษ 1980, 2.2% ในช่วงทศวรรษ 1990, 0.7% ในช่วงทศวรรษ 2000 และ 0.9% ตั้งแต่ปี 2010 ถึง 2017 [ 130 ]เหตุผลสำหรับการเติบโตที่ช้าลงตั้งแต่ปี 2000 เป็นที่ถกเถียงกันในหมู่นักเศรษฐศาสตร์ และอาจรวมถึงประชากรสูงอายุ การเติบโตของประชากรและแรงงานที่ช้าลง การเติบโตของผลิตภาพที่ช้าลง การลงทุนของบริษัทที่ลดลง ความเหลื่อมล้ำทางรายได้ที่มากขึ้นทำให้ความต้องการลดลง การขาดนวัตกรรมที่สำคัญ และกำลังแรงงานที่ลดลง[ 131 ]ในปี 2017 สหรัฐอเมริกาอยู่ในอันดับที่ 20 จาก 220 ประเทศในด้านGDP ต่อหัว[ 132 ]ในบรรดาประธานาธิบดีสหรัฐฯ ยุคใหม่บิล คลินตัน มีอัตราการเพิ่มขึ้นของ GDP จริงสะสมสูงสุดในช่วงสองวาระ รอง ลงมาคือโรนัลด์ เรแกนและบารัค โอบามา[ 128 ]
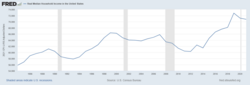
การพัฒนา GDP ของประเทศตามข้อมูลของธนาคารโลก : [ 133 ] GDP จริงของสหรัฐฯ เติบโตเฉลี่ย 1.7% ตั้งแต่ปี 2000 ถึงครึ่งแรกของปี 2014 ซึ่งเป็นอัตราประมาณครึ่งหนึ่งของค่าเฉลี่ยในอดีตจนถึงปี 2000 [ 134 ]

ตามภาคเศรษฐกิจ
องค์ประกอบภาคส่วนของ GDP ตามนาม

องค์ประกอบภาคส่วนของ GDP ตามนามในปี 2015 (หน่วยเป็นล้านดอลลาร์) ที่ราคาคงที่ในปี 2005 [ 135 ]
| ประเทศ/เศรษฐกิจ | ผลิตภัณฑ์มวลรวมภายในประเทศที่แท้จริง | เกษตร. | สินธุ | บริการ |
|---|---|---|---|---|
| โลก | 60,093,221 | 1,968,215 | 16,453,140 | 38,396,695 |
| 15,160,104 | 149,023 | 3,042,332 | 11,518,980 |
องค์ประกอบภาคส่วนของ GDP ตามชื่อเรียก ปี 2016 (หน่วยเป็นล้านดอลลาร์) ณ ราคาปัจจุบัน[ 136 ]
| ประเทศ/เศรษฐกิจ | ผลิตภัณฑ์มวลรวมภายในประเทศตามราคาตลาด (GDP) | เกษตร. | สินธุ | บริการ | |
|---|---|---|---|---|---|
| 18,624,450 | 204,868.95 | 3,613,143.3 | 14,806,437.75 | ||
| *เปอร์เซ็นต์จากCIA World Factbook [ 137 ] | |||||
การจ้างงาน


ในปี 2017 มีแรงงานในสหรัฐอเมริกาประมาณ 160.4 ล้านคน ซึ่งเป็นแรงงานที่ใหญ่เป็นอันดับสี่ของโลก รองจากจีน อินเดีย และสหภาพยุโรป[ 139 ] ในปี 2010 รัฐบาล (รัฐบาลกลาง รัฐ และท้องถิ่น) จ้างงาน 22 ล้านคน[ 140 ]ธุรกิจขนาดเล็กเป็นนายจ้างรายใหญ่ที่สุดของประเทศ คิดเป็น 37% ของแรงงานชาวอเมริกัน[ 141 ]ส่วนแบ่งการจ้างงานที่ใหญ่เป็นอันดับสองเป็นของธุรกิจขนาดใหญ่ ซึ่งจ้างงาน 36% ของแรงงานในสหรัฐอเมริกา[ 141 ]พนักงานออฟฟิศคิดเป็น 44% ของแรงงานทั้งหมดในปี 2022 เพิ่มขึ้นจาก 34% ในปี 2000 [ 142 ]
ภาคเอกชนของประเทศจ้างงานชาวอเมริกันวัยทำงานถึง 85% รัฐบาลจ้างงานชาวอเมริกันเพียง 14% ขององค์กรจ้างงานเอกชนทั้งหมดในสหรัฐอเมริกากว่า 99% เป็นธุรกิจขนาดเล็ก[ 141 ]ธุรกิจขนาดเล็ก 30 ล้านแห่งในสหรัฐอเมริกาคิดเป็น 64% ของงานที่สร้างขึ้นใหม่ (งานที่สร้างขึ้นลบด้วยงานที่สูญเสียไป) [ 141 ]งานในธุรกิจขนาดเล็กคิดเป็น 70% ของงานที่สร้างขึ้นในทศวรรษที่ผ่านมา[ 143 ]
สัดส่วนของชาวอเมริกันที่ทำงานในธุรกิจขนาดเล็กเทียบกับธุรกิจขนาดใหญ่ยังคงค่อนข้างคงที่ในแต่ละปี เนื่องจากธุรกิจขนาดเล็กบางแห่งกลายเป็นธุรกิจขนาดใหญ่ และธุรกิจขนาดเล็กกว่าครึ่งสามารถดำเนินกิจการได้นานกว่าห้าปี[ 141 ]ในบรรดาธุรกิจขนาดใหญ่ บริษัทที่ใหญ่ที่สุดและเป็นนายจ้างรายใหญ่ที่สุดในโลกหลายแห่งเป็นบริษัทอเมริกัน หนึ่งในนั้นคือWalmartซึ่งเป็นทั้งบริษัทที่ใหญ่ที่สุดและ เป็นนายจ้าง ภาคเอกชน ที่ใหญ่ที่สุด ในโลก Walmart จ้างงาน 2.1 ล้านคนทั่วโลก และ 1.4 ล้านคนในสหรัฐอเมริกาเพียงประเทศเดียว[ 144 ] [ 145 ]


ในสหรัฐอเมริกามีธุรกิจขนาดเล็กเกือบ 30 ล้านแห่ง กลุ่มชนกลุ่มน้อย เช่นชาวฮิสแปนิก ชาวแอฟริกันอเมริกัน ชาวเอเชียอเมริกัน และชาวอเมริกันพื้นเมือง (35% ของประชากรในประเทศ) [ 147 ]เป็นเจ้าของธุรกิจ 4.1 ล้านแห่งในประเทศ ธุรกิจที่เป็นเจ้าของโดยชนกลุ่มน้อยสร้าง รายได้เกือบ 700 พันล้านดอลลาร์สหรัฐ และจ้างงานเกือบ 5 ล้านคนในสหรัฐอเมริกา[ 141 ] [ 148 ] ชาวอเมริกันมีรายได้เฉลี่ย ของพนักงาน สูงที่สุดในบรรดาประเทศ OECD [ 149 ]รายได้ครัวเรือนเฉลี่ยในสหรัฐอเมริกา ณ ปี 2551 คือ 52,029 ดอลลาร์สหรัฐ[ 150 ]ประมาณ 284,000 คนทำงานในสหรัฐอเมริกามีงานเต็มเวลาสองงาน และ 7.6 ล้านคนมีงานพาร์ทไทม์เพิ่มเติมจากงานเต็มเวลา[ 140 ]จากจำนวนคนทำงานทั้งหมดในสหรัฐอเมริกา 12% เป็นสมาชิกสหภาพแรงงาน และสมาชิกสหภาพแรงงานส่วนใหญ่ทำงานให้กับรัฐบาล[ 140 ]การลดลงของจำนวนสมาชิกสหภาพแรงงานในสหรัฐอเมริกาในช่วงหลายทศวรรษที่ผ่านมานั้นสอดคล้องกับการลดลงของส่วนแบ่งแรงงานในระบบเศรษฐกิจ[ 151 ] [ 152 ] [ 153 ]ธนาคารโลกจัดอันดับให้สหรัฐอเมริกาเป็นอันดับหนึ่งในด้านความสะดวกในการจ้างและเลิกจ้างพนักงาน[ 154 ]สหรัฐอเมริกาเป็นประเทศเศรษฐกิจที่พัฒนาแล้วเพียงประเทศเดียวที่ไม่ได้ให้การรับประกันตามกฎหมายว่าพนักงานจะได้รับวันหยุดพักผ่อนหรือวันลาป่วยโดยได้รับ ค่าจ้าง และเป็นหนึ่งในไม่กี่ประเทศในโลกที่ไม่มี สิทธิ ลาหยุดเพื่อดูแลครอบครัวโดยได้รับค่าจ้างตามกฎหมายโดยประเทศอื่นๆ ได้แก่ปาปัวนิวกินีซูรินามและไลบีเรีย[ 155 ] [ 156 ] [ 157 ]ในปี 2014 และอีกครั้งในปี 2020 สหพันธ์สหภาพแรงงานระหว่างประเทศได้ให้คะแนนสหรัฐอเมริกาที่ 4 จาก 5+ ซึ่งเป็นคะแนนต่ำที่สุดเป็นอันดับสาม ในเรื่องสิทธิของคนงาน[ 158 ] [ 159 ]ในทำนองเดียวกัน การศึกษาที่ตีพิมพ์ในปี 2023 โดยOxfamพบว่าสหรัฐอเมริกาอยู่ในกลุ่มประเทศพัฒนาแล้วที่มีการคุ้มครองแรงงานแย่ที่สุด[ 160 ] [ 161 ]นักวิชาการบางคน รวมถึงนักทฤษฎีธุรกิจJeffrey Pfefferและนักวิทยาศาสตร์การเมือง แดเนียล คินเดอร์แมน ตั้งสมมติฐานว่า แนวปฏิบัติด้านการจ้างงานในปัจจุบันของสหรัฐอเมริกาที่เกี่ยวข้องกับแรงกดดันด้านประสิทธิภาพที่เพิ่มขึ้นจากฝ่ายบริหาร และความยากลำบากที่พนักงานต้องเผชิญ เช่น สภาพแวดล้อมการทำงานที่เป็นพิษความไม่มั่นคงและชั่วโมงการทำงานที่ยาวนาน อาจเป็นสาเหตุของการเสียชีวิตเกินกว่าปกติถึง 120,000 รายต่อปี ทำให้สถานที่ทำงานเป็นสาเหตุการเสียชีวิตอันดับที่ 5 ในสหรัฐอเมริกา[ 162 ] [ 163 ] [ 164 ]
การว่างงาน

ณ เดือนธันวาคม พ.ศ. 2560 อัตรา การว่างงานในสหรัฐอเมริกาอยู่ที่ 4.1% [ 165 ]หรือ 6.6 ล้านคน[ 166 ]อัตราการว่างงาน U-6 ของรัฐบาล ซึ่งรวมถึงผู้ที่ทำงานไม่ เต็มเวลาแต่ยังทำงานไม่เต็มเวลาด้วย อยู่ที่ 8.1% [ 167 ]หรือ 8.2 ล้านคน ตัวเลขเหล่านี้คำนวณจากกำลังแรงงานพลเรือนประมาณ 160.6 ล้านคน[ 168 ]เมื่อเทียบกับประชากรของสหรัฐอเมริกาประมาณ 327 ล้านคน[ 169 ]
ระหว่างปี 2009 ถึง 2010 หลังจากภาวะเศรษฐกิจถดถอยครั้งใหญ่ ปัญหาการฟื้นตัวทางเศรษฐกิจที่ไม่มีการจ้างงาน เกิดขึ้น ส่งผลให้อัตราการว่างงานระยะยาวสูง เป็นประวัติการณ์ โดยมีคนงานมากกว่า 6 ล้านคนหางานทำนานกว่า 6 เดือน ณ เดือนมกราคม 2010 ซึ่งส่งผลกระทบต่อคนงานสูงอายุเป็นพิเศษ[ 170 ]หนึ่งปีหลังจากภาวะเศรษฐกิจถดถอยสิ้นสุดลงในเดือนมิถุนายน 2009 ผู้อพยพได้รับงาน 656,000 ตำแหน่งในสหรัฐอเมริกา ในขณะที่คนงานที่เกิดในสหรัฐอเมริกาสูญเสียงานไปมากกว่าหนึ่งล้านตำแหน่ง ส่วนหนึ่งเป็นผลมาจากประเทศที่มีประชากรสูงอายุมากขึ้น (มีผู้เกษียณอายุผิวขาวมากกว่า) และการเปลี่ยนแปลงทางประชากรศาสตร์[ 171 ] ในเดือนเมษายน 2010 อัตราการว่างงานอย่างเป็นทางการอยู่ที่ 9.9% แต่อัตรา การว่างงาน U-6ที่กว้างกว่าของรัฐบาลอยู่ที่ 17.1% [ 172 ]ระหว่างเดือนกุมภาพันธ์ พ.ศ. 2551 ถึงเดือนกุมภาพันธ์ พ.ศ. 2553 จำนวนผู้ที่ทำงานพาร์ทไทม์ด้วยเหตุผลทางเศรษฐกิจ (เช่น ต้องการทำงานเต็มเวลา) เพิ่มขึ้น 4 ล้านคน เป็น 8.8 ล้านคน คิดเป็นการเพิ่มขึ้นร้อยละ 83 ของผู้ทำงานพาร์ทไทม์ในช่วงสองปีดังกล่าว[ 173 ]
แม้ว่าอัตราการว่างงานจะลดลงต่ำกว่า 8% ในปี 2013 แต่สัดส่วนของผู้ว่างงานระยะยาวที่สูงเป็นประวัติการณ์และรายได้ครัวเรือนที่ลดลงอย่างต่อเนื่องยังคงบ่งชี้ถึงการฟื้นตัวที่ปราศจากการจ้างงาน[ 174 ]อย่างไรก็ตาม จำนวนงานที่มีเงินเดือนกลับคืนสู่ระดับก่อนภาวะเศรษฐกิจถดถอย (พฤศจิกายน 2007) ในเดือนพฤษภาคม 2014 เนื่องจากเศรษฐกิจฟื้นตัว[ 175 ]
หลังจากที่อัตราการว่างงานของสหรัฐฯ สูงขึ้นในช่วงหลังสงคราม อัตราการว่างงานของสหรัฐฯ ก็ลดลงต่ำกว่าอัตราการว่างงานที่เพิ่มขึ้นของยูโรโซนในช่วงกลางทศวรรษ 1980 และยังคงต่ำกว่าอย่างมีนัยสำคัญเกือบต่อเนื่องมาจนถึงปัจจุบัน[ 176 ] [ 177 ] [ 178 ]ในปี 1955 ชาวอเมริกัน 55% ทำงานในภาคบริการ ระหว่าง 30% ถึง 35% ทำงานในภาคอุตสาหกรรม และระหว่าง 10% ถึง 15% ทำงานในภาคเกษตรกรรมแต่ในปี 1980 กว่า 65% ทำงานในภาคบริการ ระหว่าง 25% ถึง 30% ทำงานในภาคอุตสาหกรรม และน้อยกว่า 5% ทำงานในภาคเกษตรกรรม[ 179 ]อัตราการว่างงานของผู้ชายยังคงสูงกว่าของผู้หญิงอย่างมีนัยสำคัญ (ที่ 9.8% เทียบกับ 7.5% ในปี 2009) อัตราการว่างงานในกลุ่มคนผิวขาวก็ยังคงต่ำกว่ากลุ่มคนแอฟริกัน-อเมริกันมาก (ที่ 8.5% เทียบกับ 15.8% ในปี 2009 เช่นกัน) [ 180 ]
อัตราการว่างงานของเยาวชนอยู่ที่ 18.5% ในเดือนกรกฎาคม พ.ศ. 2552 ซึ่งเป็นอัตราสูงสุดในเดือนนั้นนับตั้งแต่ปี พ.ศ. 2491 [ 181 ]อัตราการว่างงานของเยาวชนชาวแอฟริกันอเมริกันอยู่ที่ 28.2% ในเดือนพฤษภาคม พ.ศ. 2556 [ 182 ]
อัตราการว่างงานพุ่งสูงถึงระดับสูงสุดเป็นประวัติการณ์ที่ 14.7% ในเดือนเมษายน 2020 ก่อนจะลดลงเหลือ 11.1% ในเดือนมิถุนายน 2020 เนื่องมาจากผลกระทบของการระบาดใหญ่ของ COVID-19ทำให้ GDP ไตรมาสที่ 2 ของสหรัฐฯ ลดลง 32.9% ในปี 2020 [ 183 ] [ 184 ] [ 185 ]อัตราการว่างงานยังคงลดลงอย่างรวดเร็วเหลือ 3.9% ในปี 2021 [ 186 ]และลดลงเหลือ 3.7% ในเดือนพฤษภาคม 2023 [ 187 ]
ในปี 2025 ตลาดแรงงานของสหรัฐอเมริกาประสบกับการเปลี่ยนแปลงที่เห็นได้ชัด โดยมีลักษณะการจ้างงานที่หยุดนิ่งและการเลิกจ้างที่เพิ่มขึ้น ตามรายงานของรอยเตอร์ ระหว่างเดือนมกราคมถึงกันยายน 2025 บริษัทในสหรัฐฯ ประกาศลดตำแหน่งงานประมาณ 950,000 ตำแหน่ง โดยภาคเทคโนโลยี ค้าปลีก และภาครัฐมีส่วนแบ่งมากที่สุด นักวิเคราะห์อธิบายแนวโน้มนี้ว่าเป็นช่วงเปลี่ยนผ่านจากสภาพแวดล้อมแบบ “ไม่จ้างงาน ไม่ไล่ออก” ไปสู่ระยะ “ไม่จ้างงาน ไล่ออกมากขึ้น” ซึ่งสะท้อนถึงความระมัดระวังขององค์กรที่เพิ่มขึ้นและโมเมนตัมทางเศรษฐกิจที่ชะลอตัว[ 188 ]
ข้อมูลเศรษฐกิจที่เผยแพร่ในช่วงปลายปี 2025 แสดงให้เห็นสัญญาณของการชะลอตัวในเศรษฐกิจสหรัฐฯ อัตราการว่างงานเพิ่มขึ้นเป็น 4.6% ในเดือนพฤศจิกายน ซึ่งเป็นระดับสูงสุดนับตั้งแต่ปี 2021 ในขณะที่การสร้างงานชะลอตัวลง โดยมีการเพิ่มงานเพียง 64,000 ตำแหน่ง ลดลงจากเดือนก่อนหน้า[ 189 ]
ข้อมูลบางส่วนยังแสดงให้เห็นถึงการลดลงของการจ้างงานในเดือนตุลาคม โดยนักวิเคราะห์ตั้งข้อสังเกตถึงโมเมนตัมการจ้างงานที่อ่อนแอลงท่ามกลางอัตราเงินเฟ้อที่สูงขึ้นและต้นทุนการกู้ยืมที่สูงขึ้น ในขณะเดียวกัน ยอดขายปลีกยังคงทรงตัวในช่วงเริ่มต้นของฤดูกาลวันหยุด ทำให้เกิดความกังวลเกี่ยวกับการใช้จ่ายของผู้บริโภค ซึ่งคิดเป็นสัดส่วนใหญ่ของกิจกรรมทางเศรษฐกิจของสหรัฐฯ[ 190 ] [ 191 ]
เศรษฐกิจสหรัฐฯ เริ่มต้นปี 2026 โดยยังคงอยู่ในสถานะ "มีตำแหน่งงานว่างสูง" บนเส้นโค้ง Beveridgeซึ่งพิจารณาความสัมพันธ์ระหว่างตำแหน่งงานว่างและอัตราการว่างงาน[ 192 ]ณ สิ้นเดือนมกราคม 2026 อัตราการจ้างงานและการเลิกจ้างยังคงอยู่ในระดับต่ำ ทำให้อัตราการว่างงานยังคงอยู่ในช่วงจำกัด[ 192 ]อย่างไรก็ตาม จำนวนตำแหน่งงานว่างที่ต่ำหมายความว่า หากการเลิกจ้างเพิ่มขึ้น อัตราการว่างงานก็จะเพิ่มขึ้นตามไปด้วย[ 192 ]
การจ้างงานแยกตามภาคส่วน
การจ้างงานในสหรัฐอเมริกาตามที่ประเมินไว้ในปี 2555 แบ่งออกเป็น 79.7% ในภาคบริการ 19.2% ในภาคการผลิต และ 1.1% ในภาคเกษตรกรรม[ 193 ]
รายได้และความมั่งคั่ง


มาตรการรายได้
รายได้เฉลี่ยต่อคนต่อวันของชาวอเมริกันอยู่ที่ 70 ดอลลาร์สหรัฐ ( PPP ) ในปี 2023 ซึ่งเป็นหนึ่งในระดับที่สูงที่สุดในโลก[ 195 ]รายได้เฉลี่ยครัวเรือนที่แท้จริง (เช่น ปรับตามอัตราเงินเฟ้อ) ซึ่งเป็นมาตรวัดที่ดีของรายได้ชนชั้นกลาง อยู่ที่ 59,039 ดอลลาร์สหรัฐในปี 2016 ซึ่งเป็นระดับสูงสุดเป็นประวัติการณ์ อย่างไรก็ตาม อยู่ที่ระดับสูงกว่าสถิติสูงสุดก่อนหน้านี้ที่ตั้งไว้ในปี 1998 เพียงเล็กน้อย ซึ่งบ่งชี้ว่ากำลังซื้อของรายได้ครอบครัวชนชั้นกลางนั้นคงที่หรือลดลงในช่วงยี่สิบปีที่ผ่านมา[ 196 ]จากการวิเคราะห์หนึ่งพบว่ารายได้ชนชั้นกลางในสหรัฐอเมริกาลดลงมาเท่ากับในแคนาดาในปี 2010 และอาจล้าหลังไปในปี 2014 ในขณะที่ประเทศเศรษฐกิจที่พัฒนาแล้วอื่นๆ อีกหลายประเทศได้ลดช่องว่างลงในช่วงไม่กี่ปีที่ผ่านมา[ 197 ]
ชาวอเมริกันมี รายได้ครัวเรือนเฉลี่ยสูงที่สุดในบรรดาประเทศ OECD [ 198 ] [ 149 ]ในปี 2013 ค่าตอบแทนพนักงานอยู่ที่ 8.969 ล้านล้านดอลลาร์ ในขณะที่การลงทุนภาคเอกชนรวมอยู่ที่ 2.781 ล้านล้าน ดอลลาร์ [ 199 ]
ความเหลื่อมล้ำทางรายได้

| บทความนี้เป็นส่วนหนึ่งของชุดบทความเกี่ยวกับ... |
| รายได้ในสหรัฐอเมริกา |
|---|
 |
ความเหลื่อมล้ำทางรายได้ในสหรัฐอเมริกาผันผวนอย่างมากนับตั้งแต่เริ่มมีการวัดผลราวปี 1915 โดยเคลื่อนตัวเป็นเส้นโค้งระหว่างจุดสูงสุดในช่วงทศวรรษ 1920 และ 2000 โดยมีระดับความเหลื่อมล้ำที่ต่ำกว่าในช่วงประมาณปี 1950-1980 (ช่วงเวลาที่เรียกว่าการบีบอัดครั้งใหญ่ ) ตามมาด้วยความเหลื่อมล้ำที่เพิ่มขึ้น ซึ่งถูกเรียกว่าการแยกตัว ครั้งใหญ่
สหรัฐอเมริกามีระดับความเหลื่อมล้ำทางรายได้สูงที่สุดในกลุ่มประเทศอุตสาหกรรมด้วยกัน[ 200 ]เมื่อวัดจากครัวเรือนทั้งหมด ความเหลื่อมล้ำทางรายได้ของสหรัฐอเมริกาเทียบได้กับประเทศพัฒนาแล้วอื่นๆ ก่อนหักภาษีและเงินโอน แต่จัดอยู่ในกลุ่มประเทศที่มีระดับความเหลื่อมล้ำสูงที่สุดหลังหักภาษีและเงินโอน ซึ่งหมายความว่าสหรัฐอเมริกามีการโยกย้ายรายได้จากครัวเรือนที่มีรายได้สูงไปยังครัวเรือนที่มีรายได้ต่ำน้อยกว่า ในปี 2559 รายได้เฉลี่ยในตลาดอยู่ที่ 15,600 ดอลลาร์สหรัฐสำหรับกลุ่มที่มี รายได้ต่ำที่สุด และ 280,300 ดอลลาร์สหรัฐสำหรับกลุ่มที่มีรายได้สูงที่สุด ระดับความเหลื่อมล้ำเพิ่มสูงขึ้นในกลุ่มที่มีรายได้สูงสุด โดย 1% ของประชากรที่มีรายได้สูงสุดมีรายได้ 1.8 ล้านดอลลาร์สหรัฐ ซึ่งสูงกว่ารายได้ 59,300 ดอลลาร์สหรัฐของกลุ่มที่มีรายได้ปานกลางประมาณ 30 เท่า[ 201 ]
ผลกระทบทางเศรษฐกิจและการเมืองของความไม่เท่าเทียมกันอาจรวมถึงการเติบโต ของGDP ที่ช้าลงการเคลื่อนย้ายรายได้ ที่ลดลง อัตราความยากจนที่สูงขึ้น การใช้หนี้ครัวเรือน มากขึ้น ซึ่งนำไปสู่ความเสี่ยงที่เพิ่มขึ้นของวิกฤตการณ์ทางการเงิน และการแบ่งขั้วทางการเมือง[ 202 ] [ 203 ]สาเหตุของความไม่เท่าเทียมกันอาจรวมถึงค่าตอบแทนผู้บริหารที่เพิ่มขึ้นเมื่อเทียบกับคนงานโดยเฉลี่ยการทำให้เป็นระบบการเงิน การ กระจุกตัวของอุตสาหกรรม ที่มากขึ้น อัตรา การรวมตัวของสหภาพแรงงานที่ต่ำลงอัตราภาษีที่มีประสิทธิภาพต่ำลงสำหรับรายได้ที่สูงขึ้น และการเปลี่ยนแปลงทางเทคโนโลยีที่ให้รางวัลแก่ผู้ที่มีการศึกษาสูงขึ้น[ 204 ]
การวัดค่าความไม่เท่าเทียมกันเป็นที่ถกเถียงกัน เนื่องจากมาตรวัดความไม่เท่าเทียมกันมีความแตกต่างกันอย่างมาก ตัวอย่างเช่น ในชุดข้อมูล ต่างๆ [ 205 ] [ 206 ]หรือไม่ว่าการวัดจะทำบนพื้นฐานของค่าตอบแทนเป็นเงินสด (รายได้จากตลาด) หรือหลังหักภาษีและเงินโอนค่าสัมประสิทธิ์ Giniเป็นสถิติที่ได้รับการยอมรับอย่างกว้างขวาง ซึ่งช่วยให้สามารถเปรียบเทียบระหว่างเขตอำนาจศาลต่างๆ ได้ โดย 0 แสดงถึงความเท่าเทียมกันอย่างสมบูรณ์ และ 1 แสดงถึงความไม่เท่าเทียมกันสูงสุด นอกจากนี้ ชุดข้อมูลสาธารณะและเอกชนต่างๆ ยังวัดรายได้เหล่านั้น เช่น จากสำนักงานงบประมาณรัฐสภา (CBO) [ 201 ]กรมสรรพากร และสำมะโนประชากร[ 207 ]ตามข้อมูลของสำนักงานสำมะโนประชากร ความไม่เท่าเทียมกันของรายได้แตะระดับสูงสุดเป็นประวัติการณ์ในปี 2018 โดยมีค่า Gini เท่ากับ 0.485 [ 208 ]ตั้งแต่นั้นมา สำนักงานสำมะโนประชากรได้ให้ค่า 0.488 ในปี 2020 และ 0.494 ในปี 2021 ต่อรายได้เงินสดก่อนหักภาษี[ 209 ]
นโยบาย ภาษีและการโอนเงินของสหรัฐฯ เป็น แบบก้าวหน้าดังนั้นจึงช่วยลดความเหลื่อมล้ำทางรายได้ที่มีประสิทธิภาพ เนื่องจากอัตราภาษีโดยทั่วไปจะเพิ่มขึ้นตามรายได้ที่ต้องเสียภาษีที่เพิ่มขึ้น โดยรวมแล้วผู้ทำงาน ที่มีรายได้ต่ำที่สุด โดยเฉพาะผู้ที่มีผู้พึ่งพา ไม่ต้องเสียภาษีเงินได้ และอาจได้รับเงินอุดหนุนเล็กน้อยจากรัฐบาลกลาง (จากเครดิตสำหรับเด็กและเครดิตภาษีรายได้จากการทำงาน ) [ 210 ]ค่าสัมประสิทธิ์ Gini ของสหรัฐฯ ในปี 2016 อยู่ที่ 0.59 โดยอิงจากรายได้ตลาด ลดลงเหลือ 0.42 หลังหักภาษีและโอนเงิน ตามตัวเลขของสำนักงานงบประมาณรัฐสภา (CBO) ส่วนแบ่งรายได้ตลาดสูงสุด 1% เพิ่มขึ้นจาก 9.6% ในปี 1979 ไปสู่จุดสูงสุดที่ 20.7% ในปี 2007 ก่อนที่จะลดลงเหลือ 17.5% ในปี 2016 หลังหักภาษีและโอนเงิน ตัวเลขเหล่านี้อยู่ที่ 7.4%, 16.6% และ 12.5% ตามลำดับ[ 201 ]
มูลค่าสุทธิของครัวเรือนและความเหลื่อมล้ำทางความมั่งคั่ง


ณ ไตรมาสที่ 4 ปี 2017 มูลค่าสุทธิรวมของครัวเรือนในสหรัฐอเมริกาอยู่ที่ 99 ล้านล้านดอลลาร์ ซึ่งเป็นสถิติสูงสุด เพิ่มขึ้น 5.2 ล้านล้านดอลลาร์จากปี 2016 การเพิ่มขึ้นนี้สะท้อนให้เห็นถึงกำไรจากทั้งตลาดหุ้นและราคาบ้าน ตัวเลขนี้สร้างสถิติสูงสุดมาตั้งแต่ไตรมาสที่ 4 ปี 2012 [ 212 ]หากแบ่งอย่างเท่าเทียมกัน 99 ล้านล้านดอลลาร์จะคิดเป็นเฉลี่ย 782,000 ดอลลาร์ต่อครัวเรือน (สำหรับครัวเรือนประมาณ 126.2 ล้านครัวเรือน) หรือ 302,000 ดอลลาร์ต่อคน อย่างไรก็ตาม มูลค่าสุทธิเฉลี่ยของครัวเรือน (เช่น ครึ่งหนึ่งของครอบครัวที่อยู่เหนือและต่ำกว่าระดับนี้) อยู่ที่ 97,300 ดอลลาร์ในปี 2016 ครอบครัว 25% ล่างสุดมีมูลค่าสุทธิเฉลี่ยเป็นศูนย์ ในขณะที่เปอร์เซ็นไทล์ที่ 25 ถึง 50 มีมูลค่าสุทธิเฉลี่ย 40,000 ดอลลาร์[ 213 ]
ความเหลื่อมล้ำทางความมั่งคั่งนั้นมากกว่าความเหลื่อมล้ำทางรายได้ โดยครัวเรือน 1% ที่ร่ำรวยที่สุดเป็นเจ้าของทรัพย์สินสุทธิประมาณ 42% ในปี 2555 เทียบกับ 24% ในปี 2522 [ 214 ]จากรายงานของธนาคารกลางสหรัฐในเดือนกันยายน 2560 ความเหลื่อมล้ำทางความมั่งคั่งอยู่ในระดับสูงสุดเป็นประวัติการณ์ โดยครัวเรือน 1% ที่ร่ำรวยที่สุดควบคุมความมั่งคั่งของประเทศถึง 38.6% ในปี 2559 [ 215 ] รายงาน ของBoston Consulting Groupในเดือนมิถุนายน 2560 ระบุว่า 1% ของชาวอเมริกันจะควบคุมความมั่งคั่งของประเทศถึง 70% ภายในปี 2564 [ 216 ]
กลุ่มคนรวยที่สุด 10% แรกครอบครองสินทรัพย์ทางการเงินทั้งหมด 80% [ 217 ]ความเหลื่อมล้ำทางความมั่งคั่งในสหรัฐอเมริกาสูงกว่าในประเทศพัฒนาแล้วส่วนใหญ่ ยกเว้นสวีเดน[ 218 ]ความมั่งคั่งที่ได้รับสืบทอดมาอาจช่วยอธิบายได้ว่าทำไมชาวอเมริกันจำนวนมากที่ร่ำรวยจึงอาจมี "ความได้เปรียบอย่างมาก" [ 219 ] [ 220 ]ในเดือนกันยายน 2012 ตามรายงานของสถาบันวิจัยนโยบาย "กว่า 60 เปอร์เซ็นต์" ของชาวอเมริกันที่ร่ำรวยที่สุด 400 คนของ Forbes "เติบโตมาในสิทธิพิเศษอย่างมาก" [ 221 ]ความมั่งคั่งเฉลี่ยของครัวเรือนในสหรัฐอเมริกาลดลง 35% จาก 106,591 ดอลลาร์เหลือ 68,839 ดอลลาร์ระหว่างปี 2005 ถึง 2011 เนื่องมาจากภาวะเศรษฐกิจถดถอยครั้งใหญ่แต่ได้ฟื้นตัวขึ้นแล้วดังที่กล่าวไว้ข้างต้น[ 222 ]
ประมาณ 30% ของประชากรเศรษฐีทั่วโลกอาศัยอยู่ในสหรัฐอเมริกา (ข้อมูล ณ ปี 2009) [ 223 ]หน่วยงาน Economist Intelligence Unitประเมินในปี 2008 ว่ามีเศรษฐี 16,600,000 คนในสหรัฐอเมริกา[ 224 ]นอกจากนี้ 34% ของมหาเศรษฐีทั่วโลกเป็นชาวอเมริกัน (ข้อมูล ณ ปี 2011) [ 225 ] [ 226 ]
การเป็นเจ้าของบ้าน

อัตราการเป็นเจ้าของบ้านของสหรัฐฯ ในไตรมาสที่ 1 ปี 2018 อยู่ที่ 64.2% ซึ่งต่ำกว่าระดับสูงสุดตลอดกาลที่ 69.2% ซึ่งเกิดขึ้นในไตรมาสที่ 4 ปี 2004 ในช่วงฟองสบู่อสังหาริมทรัพย์บ้านหลายล้านหลังถูกยึดเนื่องจากการจำนองในช่วงภาวะเศรษฐกิจถดถอยครั้งใหญ่ปี 2007–2009 ทำให้อัตราการเป็นเจ้าของบ้านลดลงต่ำสุดที่ 62.9% ในไตรมาสที่ 2 ปี 2016 อัตราการเป็นเจ้าของบ้านโดยเฉลี่ยตั้งแต่ปี 1965 ถึง 2017 อยู่ที่ 65.3% [ 227 ]
บ้านโดยเฉลี่ยในสหรัฐอเมริกามีพื้นที่มากกว่า 700 ตารางฟุตต่อคน (65 ตารางเมตร) ซึ่งมากกว่าค่าเฉลี่ยในประเทศที่มีรายได้สูงอื่นๆ ถึง 50%–100% ในทำนองเดียวกัน อัตราการเป็นเจ้าของอุปกรณ์และสิ่งอำนวยความสะดวกต่างๆ ก็ค่อนข้างสูงเมื่อเทียบกับประเทศอื่นๆ[ 228 ] [ 229 ] [ 230 ]
รายงานของ Pew Research Center ในปี 2016 ระบุว่า เป็นครั้งแรกในรอบ 130 ปี ที่ชาวอเมริกันอายุ 18 ถึง 34 ปี มีแนวโน้มที่จะอาศัยอยู่กับพ่อแม่มากกว่าอยู่ในสถานการณ์การอยู่อาศัยแบบอื่น[ 231 ]
จากการศึกษาวิจัยของ ATTOM Data Solutions พบว่า 70% ของเขตที่ทำการสำรวจ บ้านมีราคาแพงขึ้นเรื่อยๆ จนคนทำงานทั่วไปในสหรัฐอเมริกาไม่สามารถซื้อได้[ 232 ]
ณ ปี 2018 จำนวนพลเมืองสหรัฐฯ ที่อาศัยอยู่ในรถยนต์เพิ่มขึ้นในเมืองใหญ่ที่มีค่าใช้จ่ายด้านที่อยู่อาศัยสูงกว่าค่าเฉลี่ยอย่างมีนัยสำคัญ เช่นลอสแอนเจลิสพอร์ตแลนด์และซานฟรานซิสโก[ 233 ] [ 234 ]
ตามรายงานของCNBCราคาขายเฉลี่ยของบ้านในสหรัฐอเมริกาในปี 2017 อยู่ที่ 199,200 ดอลลาร์สหรัฐ[ 235 ]ภายในเดือนกุมภาพันธ์ 2023 ราคาขายเฉลี่ยของบ้านในสหรัฐอเมริกาเพิ่มขึ้นเป็น 392,000 ดอลลาร์สหรัฐ ตามรายงานของStatista [ 236 ] สหรัฐอเมริกากำลังประสบปัญหาการขาดแคลนที่อยู่อาศัยทั่วประเทศ ซึ่งเกิดจากการก่อสร้างที่อยู่อาศัยไม่เพียงพอ (ซึ่งลดลงอย่างมากหลังจากภาวะเศรษฐกิจถดถอยครั้งใหญ่ ในปี 2008 ) และทำให้ค่าเช่าและราคาบ้านสูงขึ้นจนเกินกำลังซื้อ โดยมีการประมาณการว่าการขาดแคลนอยู่ที่ 3.8 ล้านยูนิตในปี 2019 และการขาดแคลนนี้แย่ลงในช่วงและหลังการระบาดใหญ่[ 237 ] [ 238 ]
ณ เดือนมกราคม พ.ศ. 2567 ในเมืองต่างๆ ในสหรัฐอเมริการาวครึ่งหนึ่ง คนงานจำเป็นต้องมีรายได้ 100,000 ดอลลาร์ขึ้นไปเพื่อซื้อบ้าน อันเป็นผลมาจากราคาบ้านที่สูงขึ้นและอัตราดอกเบี้ยที่เพิ่มขึ้น[ 239 ]
กำไรและค่าจ้าง

ค่าจ้างที่แท้จริง (ค่าจ้างที่ปรับตามอัตราเงินเฟ้อ) สำหรับคนงานส่วนใหญ่ในสหรัฐอเมริกาและรายได้เฉลี่ยลดลงหรือคงที่ในช่วงยี่สิบถึงสี่สิบปีที่ผ่านมา[ 240 ] [ 241 ] [ 242 ] [ 243 ]การวิเคราะห์เชิงจุลภาคในปี 2020 แสดงให้เห็นว่าในช่วงสี่ทศวรรษที่ผ่านมา ส่วนแบ่งแรงงานของผลผลิตของประเทศลดลง ในขณะที่ในช่วงเวลาเดียวกัน ส่วนแบ่งกำไรของผลผลิตเดียวกันกลับเพิ่มขึ้น[ 244 ]
ในปี พ.ศ. 2513 ค่าจ้างคิดเป็นมากกว่า 51% ของ GDP ของสหรัฐฯ และกำไรน้อยกว่า 5% แต่ในปี พ.ศ. 2556 ค่าจ้างลดลงเหลือ 44% ของเศรษฐกิจ ในขณะที่กำไรเพิ่มขึ้นมากกว่าสองเท่าเป็น 11% [ 245 ]รายได้ส่วนบุคคลที่ใช้จ่ายได้ต่อหัวที่ปรับตามอัตราเงินเฟ้อ ("ที่แท้จริง") เพิ่มขึ้นอย่างต่อเนื่องในสหรัฐฯ ตั้งแต่ปี พ.ศ. 2488 ถึง พ.ศ. 2551 แต่หลังจากนั้นโดยทั่วไปก็คงที่[ 246 ] [ 247 ]
ในปี พ.ศ. 2548 รายได้ส่วนบุคคลเฉลี่ยของผู้ที่มีอายุมากกว่า 18 ปี มีตั้งแต่ 3,317 ดอลลาร์สำหรับหญิงชาวอเมริกันเชื้อสายเอเชีย ที่แต่งงานแล้วและว่างงาน [ 248 ]ไปจนถึง 55,935 ดอลลาร์สำหรับชายชาวอเมริกันเชื้อสายเอเชียที่ทำงานเต็มเวลาตลอดทั้งปี[ 249 ]จากข้อมูลสำมะโนประชากรของสหรัฐอเมริกา ผู้ชายมักมีรายได้สูงกว่าผู้หญิง ในขณะที่ชาวเอเชียและชาวผิวขาวมีรายได้มากกว่าชาวแอฟริกันอเมริกันและชาวฮิสแปนิกรายได้ส่วนบุคคลเฉลี่ยโดยรวมของบุคคลทั้งหมดที่มีอายุมากกว่า 18 ปี คือ 24,062 ดอลลาร์[ 250 ] (32,140 ดอลลาร์สำหรับผู้ที่มีอายุ 25 ปีขึ้นไป) ในปี พ.ศ. 2548 [ 251 ]
เพื่อเป็นข้อมูลอ้างอิง อัตราค่าจ้างขั้นต่ำในปี 2009 และ 2017 อยู่ที่ 7.25 ดอลลาร์ต่อชั่วโมง หรือ 15,080 ดอลลาร์ สำหรับการทำงาน 2,080 ชั่วโมงในหนึ่งปีการทำงานทั่วไป ค่าจ้างขั้นต่ำนี้สูงกว่าระดับความยากจนเล็กน้อยสำหรับบุคคลโสด และประมาณ 50% ของระดับความยากจนสำหรับครอบครัวสี่คน
จากรายงานของPew Research Centerใน เดือนตุลาคม 2557 ค่าจ้างที่แท้จริงคงที่หรือลดลงในช่วงห้าทศวรรษที่ผ่านมาสำหรับคนงานส่วนใหญ่ในสหรัฐอเมริกา โดยไม่คำนึงถึงการเติบโตของงาน[ 252 ] Bloomberg รายงานในเดือนกรกฎาคม 2561 ว่า GDP ที่แท้จริงต่อหัวเติบโตขึ้นอย่างมากนับตั้งแต่ภาวะเศรษฐกิจถดถอยครั้งใหญ่[ 253 ]
จาก การสำรวจของCareerBuilder ในเดือนสิงหาคม 2017 พบว่าคนงานชาวอเมริกัน 8 ใน 10 คนใช้ชีวิตแบบเดือนชนเดือน โฆษกของ CareerBuilder อย่าง Mike Erwin กล่าวโทษว่าเป็นเพราะ "ค่าจ้างที่คงที่และต้นทุนที่สูงขึ้นของทุกอย่างตั้งแต่การศึกษาไปจนถึงสินค้าอุปโภคบริโภคหลายชนิด" [ 254 ]จากการสำรวจของสำนักงานคุ้มครองผู้บริโภคทางการเงิน ของรัฐบาล กลางเกี่ยวกับความเป็นอยู่ทางการเงินของพลเมืองสหรัฐฯ พบว่าประมาณครึ่งหนึ่งมีปัญหาในการจ่ายบิล และมากกว่าหนึ่งในสามเคยประสบกับความยากลำบาก เช่น ไม่สามารถหาที่อยู่อาศัยได้ อาหารหมด หรือไม่มีเงินเพียงพอสำหรับค่ารักษาพยาบาล[ 255 ]ตามที่นักข่าวและนักเขียนAlissa Quartกล่าวไว้ ค่าครองชีพกำลังเพิ่มขึ้นอย่างรวดเร็วแซงหน้าการเติบโตของเงินเดือนและค่าจ้าง รวมถึงค่าจ้างสำหรับอาชีพที่มั่นคงแบบดั้งเดิม เช่น การสอน เธอเขียนว่า "ชีวิตของชนชั้นกลางในปัจจุบันมีราคาแพงกว่าเมื่อ 20 ปีที่แล้วถึง 30%" [ 256 ]
ในเดือนกุมภาพันธ์ 2019 ธนาคารกลางสหรัฐสาขานิวยอร์กรายงานว่าพลเมืองสหรัฐฯ 7 ล้านคนค้างชำระค่างวดรถเป็นเวลา 3 เดือนขึ้นไป ซึ่งถือเป็นสถิติสูงสุด นักเศรษฐศาสตร์มองว่านี่เป็นสัญญาณเตือนภัย เนื่องจากชาวอเมริกันกำลังดิ้นรนที่จะจ่ายค่าใช้จ่ายต่างๆ แม้ว่าอัตราการว่างงานจะต่ำก็ตาม[ 257 ]ผลสำรวจความคิดเห็นในเดือนพฤษภาคม 2019 ที่จัดทำโดยNPRพบว่าในหมู่ชาวอเมริกันในชนบท 40% ประสบปัญหาในการจ่ายค่ารักษาพยาบาล อาหาร และที่อยู่อาศัย และ 49% ไม่สามารถจ่ายเงินสดสำหรับค่าใช้จ่ายฉุกเฉิน 1,000 ดอลลาร์ได้ และจะเลือกกู้ยืมแทนเพื่อจ่ายค่าใช้จ่ายฉุกเฉินที่ไม่คาดคิดดังกล่าว[ 258 ]ผู้เชี่ยวชาญบางคนกล่าวว่าสหรัฐฯ ประสบกับ "การฟื้นตัวสองระดับ" ซึ่งเป็นประโยชน์ต่อประชากร 60% ในขณะที่อีก 40% ใน "ระดับล่าง" กำลังดิ้นรนที่จะจ่ายค่าใช้จ่ายต่างๆ อันเป็นผลมาจากค่าจ้างที่คงที่ ค่าใช้จ่ายด้านที่อยู่อาศัย การศึกษา และการดูแลสุขภาพที่เพิ่มขึ้น และหนี้สินที่เพิ่มขึ้น[ 259 ]
จากการศึกษาในปี 2021 โดยNational Low Income Housing Coalitionพบว่าคนงานจะต้องมีรายได้อย่างน้อย 24.90 ดอลลาร์ต่อชั่วโมงจึงจะสามารถจ่ายค่าเช่าบ้านสองห้องนอนมาตรฐานได้ (หมายความว่าไม่เกิน 30% ของรายได้ของบุคคล) หรือ 20.40 ดอลลาร์สำหรับบ้านหนึ่งห้องนอนในทุกที่ในสหรัฐอเมริกา ซึ่งอัตราแรกนั้นสูงกว่าค่าแรงขั้นต่ำของรัฐบาลกลางในปัจจุบันถึง 3.4 เท่า[ 260 ]
USCB รายงานในเดือนกันยายน พ.ศ. 2566 ว่ารายได้ลดลงในปีที่แล้วร้อยละ 2.3 เมื่อเทียบกับปี พ.ศ. 2564 ซึ่งนับเป็นปีที่สามติดต่อกันที่รายได้ลดลง[ 261 ]
ความยากจน

ตั้งแต่ทศวรรษ 1980 อัตรา ความยากจนสัมพัทธ์ได้สูงกว่าประเทศร่ำรวยอื่นๆ อย่างต่อเนื่อง แม้ว่าการวิเคราะห์โดยใช้ชุดข้อมูลทั่วไปสำหรับการเปรียบเทียบมักจะพบว่าสหรัฐอเมริกามีอัตราความยากจนสัมบูรณ์ตามรายได้จากตลาดต่ำกว่าประเทศร่ำรวยอื่นๆ ส่วนใหญ่[ 262 ]ความยากจนขั้นรุนแรงในสหรัฐอเมริกา ซึ่งหมายถึงครัวเรือนที่มีรายได้น้อยกว่า 2 ดอลลาร์ต่อวันก่อนได้รับสวัสดิการจากรัฐบาล เพิ่มขึ้นเป็นสองเท่าจากระดับในปี 1996 เป็น 1.5 ล้านครัวเรือนในปี 2011 ซึ่งรวมถึงเด็ก 2.8 ล้านคน[ 263 ]ในปี 2013 ความยากจนของเด็กพุ่งสูงเป็นประวัติการณ์ โดยมีเด็ก 16.7 ล้านคนอาศัยอยู่ใน ครัวเรือน ที่ขาดแคลนอาหารซึ่งมากกว่าระดับในปี 2007 ประมาณ 35% [ 264 ]ณ ปี 2015 เด็กในสหรัฐอเมริการ้อยละ 44 อาศัยอยู่กับครอบครัวที่มีรายได้ต่ำ[ 265 ]
ในปี 2016 ประชากร 12.7% ของสหรัฐอเมริกาอาศัยอยู่ในความยากจนลดลงจาก 13.5% ในปี 2015 อัตราความยากจนเพิ่มขึ้นจาก 12.5% ในปี 2007 ก่อน เกิด ภาวะเศรษฐกิจถดถอยครั้งใหญ่ไปสู่จุดสูงสุดที่ 15.1% ในปี 2010 ก่อนที่จะลดลงมาอยู่ที่ระดับสูงกว่าปี 2007 เล็กน้อย ในช่วงปี 1959–1962 อัตราความยากจนสูงกว่า 20% แต่ลดลงสู่ระดับต่ำสุดตลอดกาลที่ 11.1% ในปี 1973 หลังจากสงครามต่อต้านความยากจนที่เริ่มต้นในสมัยประธานาธิบดีลินดอน จอห์นสัน[ 266 ]ในเดือนมิถุนายน 2016 กองทุนการเงินระหว่างประเทศ (IMF) เตือนสหรัฐอเมริกาว่าอัตราความยากจนที่สูงจำเป็นต้องได้รับการแก้ไขอย่างเร่งด่วน[ 267 ]

ประชากรในย่านที่ยากจนข้นแค้นเพิ่มขึ้นหนึ่งในสามตั้งแต่ปี 2000 ถึง 2009 [ 269 ]ผู้คนที่อาศัยอยู่ในย่านดังกล่าวมีแนวโน้มที่จะประสบปัญหาการเข้าถึงการศึกษาที่มีคุณภาพไม่เพียงพอ อัตราการเกิดอาชญากรรมสูงขึ้น อัตราการเจ็บป่วยทางร่างกายและจิตใจสูงขึ้น การเข้าถึงสินเชื่อและการสะสมความมั่งคั่งมีจำกัด ราคาสินค้าและบริการสูงขึ้น และการเข้าถึงโอกาสในการทำงานมีจำกัด[ 269 ]ณ ปี 2013 ร้อยละ 44 ของคนยากจนในอเมริกาถือว่าอยู่ใน "ความยากจนขั้นรุนแรง" โดยมีรายได้ต่ำกว่าเส้นความยากจนอย่างเป็นทางการของรัฐบาลร้อยละ 50 หรือมากกว่า[ 270 ]
จาก รายงานการประเมินคนไร้บ้านประจำปีของ กระทรวงการเคหะและพัฒนาเมือง ของสหรัฐอเมริกา ณ ปี 2024 มีคนไร้บ้านประมาณ 771,480 คนในสหรัฐอเมริกาในแต่ละคืน หรือประมาณ 23 คนต่อประชากร 10,000 คน[ 271 ] [ 272 ]เกือบสองในสามพักอยู่ในที่พักพิงฉุกเฉินหรือโครงการที่อยู่อาศัยชั่วคราว และอีกหนึ่งในสามอาศัยอยู่บนถนน ในอาคารร้าง หรือสถานที่อื่นที่ไม่เหมาะสมสำหรับการอยู่อาศัยของมนุษย์ ประมาณ 1.56 ล้านคน หรือประมาณ 0.5% ของประชากรสหรัฐอเมริกา ใช้ที่พักพิงฉุกเฉินหรือโครงการที่อยู่อาศัยชั่วคราวระหว่างวันที่ 1 ตุลาคม 2551 ถึง 30 กันยายน 2552 [ 273 ]ประมาณ 44% ของคนไร้บ้านมีงานทำ[ 274 ] จำนวน คนไร้บ้านเพิ่มขึ้นจากปี 2559 ถึง 2563 พร้อมกับจำนวนผู้เสียชีวิตในกลุ่มคนไร้บ้านที่เพิ่มขึ้น[ 275 ]

สหรัฐอเมริกามีระบบความปลอดภัยทางสังคมที่ครอบคลุมน้อยที่สุดแห่งหนึ่งในกลุ่มประเทศพัฒนาแล้ว ซึ่งช่วยลดทั้งความยากจนเชิงสัมพัทธ์และความยากจนเชิงสัมบูรณ์ได้น้อยกว่าค่าเฉลี่ยของประเทศร่ำรวยอย่างมาก[ 276 ] [ 277 ] [ 278 ] [ 279 ] [ 280 ] ผู้เชี่ยวชาญบางคนตั้งข้อสังเกตว่าผู้ที่ยากจนอาศัยอยู่ในสภาพที่เทียบได้กับ ประเทศ กำลังพัฒนา[ 281 ] [ 282 ]รายงานเดือนพฤษภาคม 2018 โดยผู้รายงานพิเศษของสหประชาชาติว่าด้วยความยากจนขั้นรุนแรงและสิทธิมนุษยชนพบว่ามีผู้คนมากกว่า 5 ล้านคนในสหรัฐอเมริกาอาศัยอยู่ใน "สภาพแบบ 'ประเทศโลกที่สาม'" [ 283 ]ความยากจนเป็นปัจจัยเสี่ยงอันดับสี่ที่ทำให้เสียชีวิตก่อนวัยอันควรในแต่ละปี ตามการศึกษาที่ตีพิมพ์ในJAMA ในปี 2023 [ 284 ] [ 285 ] [ 286 ]ในช่วงสามทศวรรษที่ผ่านมา คนยากจนในอเมริกาถูกจำคุกในอัตราที่สูงกว่าคนยากจนในประเทศพัฒนาแล้วอื่นๆ มาก โดยการจำคุกเป็น "เรื่องปกติสำหรับผู้ชายยากจนวัยทำงาน" [ 287 ]นักวิชาการบางคนโต้แย้งว่า การเปลี่ยนแปลงไปสู่ นโยบายทางสังคมและเศรษฐกิจ แบบเสรีนิยมใหม่ที่เริ่มต้นในช่วงปลายทศวรรษ 1970 ได้ขยายรัฐลงโทษ ลดทอนรัฐสวัสดิการ สังคม ลดกฎระเบียบทางเศรษฐกิจ และทำให้ความยากจนกลายเป็นอาชญากรรม ซึ่งท้ายที่สุดแล้ว "เปลี่ยนแปลงความหมายของการเป็นคนยากจนในอเมริกา" [ 288 ] [ 289 ] [ 290 ]
นักสังคมวิทยาMatthew Desmondเขียนไว้ในหนังสือPoverty, by America ปี 2023 ของเขา ว่า สหรัฐอเมริกา "เสนอค่าจ้างที่ต่ำที่สุดแห่งหนึ่งในโลกอุตสาหกรรม" ซึ่ง "ทำให้จำนวนคนยากจนที่ทำงานเพิ่มมากขึ้น โดยส่วนใหญ่มีอายุ 35 ปีขึ้นไป" [ 291 ]นักสังคมศาสตร์Mark Robert Rankยืนยันว่า อัตราความยากจนที่สูงในสหรัฐอเมริกาสามารถอธิบายได้ส่วนใหญ่จากความล้มเหลวเชิงโครงสร้างในระดับเศรษฐกิจและการเมือง[ 292 ]
การดูแลสุขภาพ


ความคุ้มครอง
ระบบของอเมริกาเป็นการผสมผสานระหว่างประกันภัยภาครัฐและเอกชน รัฐบาลให้ความคุ้มครองด้านประกันสุขภาพแก่ผู้สูงอายุประมาณ 53 ล้านคนผ่านทางMedicare , ผู้มีรายได้น้อย 62 ล้านคนผ่านทางMedicaidและทหารผ่านศึก 15 ล้านคนผ่านทางสำนักงานกิจการทหารผ่านศึกพนักงานของบริษัทประมาณ 178 ล้านคนได้รับประกันสุขภาพที่ได้รับการอุดหนุนจากนายจ้าง ในขณะที่บุคคลอื่น ๆ อีก 52 ล้านคนซื้อประกันโดยตรงผ่านตลาดแลกเปลี่ยนที่ได้รับการอุดหนุนซึ่งพัฒนาขึ้นเป็นส่วนหนึ่งของกฎหมาย Affordable Care Actหรือซื้อโดยตรงจากบริษัทประกันภัย ภาคเอกชนให้บริการด้านการดูแลสุขภาพ ยกเว้นสำนักงานกิจการทหารผ่านศึก ซึ่งแพทย์ได้รับการว่าจ้างจากรัฐบาล[ 296 ]
ผลสำรวจหลายฉบับระบุว่าจำนวนผู้ที่ไม่มีประกันสุขภาพลดลงระหว่างปี 2013 ถึง 2016 เนื่องจากการขยาย สิทธิ์การได้รับ Medicaidและการจัดตั้งตลาดแลกเปลี่ยนประกันสุขภาพตามพระราชบัญญัติคุ้มครองผู้ป่วยและการดูแลสุขภาพราคาไม่แพงหรือที่รู้จักกันในชื่อ "ACA" หรือ "Obamacare" ตามข้อมูลของสำนักงานสำมะโนประชากรแห่งสหรัฐอเมริกาในปี 2012 มีประชากรในสหรัฐอเมริกาจำนวน 45.6 ล้านคน (14.8% ของประชากรที่มีอายุต่ำกว่า 65 ปี) ที่ไม่มีประกันสุขภาพ ตัวเลขนี้ลดลง 18.3 ล้านคน (40%) เหลือ 27.3 ล้านคน (8.6% ของประชากรที่มีอายุต่ำกว่า 65 ปี) ในปี 2016 [ 297 ]
อย่างไรก็ตาม ภายใต้ประธานาธิบดีทรัมป์ ความก้าวหน้าในการคุ้มครองด้านการดูแลสุขภาพเหล่านี้เริ่มกลับตาลปัตรกองทุนคอมมอนเวลธ์ประเมินในเดือนพฤษภาคม 2018 ว่าจำนวนผู้ที่ไม่มีประกันสุขภาพเพิ่มขึ้นสี่ล้านคนตั้งแต่ต้นปี 2016 ถึงต้นปี 2018 อัตราผู้ที่ไม่มีประกันสุขภาพเพิ่มขึ้นจาก 12.7% ในปี 2016 เป็น 15.5% ผลกระทบนั้นรุนแรงกว่าในกลุ่มผู้ใหญ่ที่มีรายได้น้อย ซึ่งมีอัตราผู้ที่ไม่มีประกันสุขภาพสูงกว่าผู้ใหญ่ที่มีรายได้สูง ในระดับภูมิภาค ภาคใต้และภาคตะวันตกมีอัตราผู้ที่ไม่มีประกันสุขภาพสูงกว่าภาคเหนือและภาคตะวันออก นอกจากนี้ รัฐทั้ง 18 รัฐที่ไม่ได้ขยายโครงการเมดิเคดมีอัตราผู้ที่ไม่มีประกันสุขภาพสูงกว่ารัฐที่ขยายโครงการเมดิเคด[ 298 ]
จากข้อมูลของPhysicians for a National Health Programการขาดประกันสุขภาพนี้ทำให้มีผู้เสียชีวิตโดยไม่จำเป็นประมาณ 48,000 รายต่อปี[ 299 ]วิธีการของกลุ่มนี้ถูกวิพากษ์วิจารณ์โดยJohn C. Goodmanว่าไม่ได้พิจารณาสาเหตุการเสียชีวิตหรือติดตามการเปลี่ยนแปลงสถานะประกันสุขภาพเมื่อเวลาผ่านไป รวมถึงเวลาที่เสียชีวิตด้วย[ 300 ]การศึกษาในปี 2009 โดย Richard Kronick อดีต ที่ปรึกษานโยบาย ของคลินตันพบว่าไม่มีอัตราการเสียชีวิตที่เพิ่มขึ้นจากการไม่มีประกันสุขภาพหลังจากควบคุมปัจจัยเสี่ยงบางอย่างแล้ว[ 301 ]
ผลลัพธ์
สหรัฐอเมริกาล้าหลังในด้านประสิทธิภาพการดูแลสุขภาพโดยรวม แต่เป็นผู้นำระดับโลกด้านนวัตกรรมทางการแพทย์อเมริกาเป็นผู้พัฒนาหรือมีส่วนร่วมอย่างมีนัยสำคัญในนวัตกรรมทางการแพทย์ที่สำคัญที่สุด 9 ใน 10 อันดับแรกนับตั้งแต่ปี 1975 ตามการจัดอันดับโดยการสำรวจความคิดเห็นของแพทย์ในปี 2001 ในขณะที่สหภาพยุโรปและสวิตเซอร์แลนด์ร่วมกันมีส่วนร่วม 5 อันดับ นับตั้งแต่ปี 1966 ชาวอเมริกันได้รับรางวัลโนเบลสาขาการแพทย์มากกว่าประเทศอื่นๆ ทั่วโลกรวมกัน ตั้งแต่ปี 1989 ถึง 2002 มีการลงทุนในบริษัทเทคโนโลยีชีวภาพเอกชนในอเมริกามากกว่าในยุโรปถึงสี่เท่า[ 302 ] [ 303 ]
จาก 17 ประเทศที่มีรายได้สูงที่สถาบันสุขภาพแห่งชาติ ศึกษา ในปี 2013 สหรัฐอเมริกาอยู่ในอันดับต้นๆ หรือใกล้เคียงกับอันดับต้นๆ ในด้านอัตราโรคอ้วน ความถี่ในการใช้รถยนต์และอุบัติเหตุ การฆาตกรรม อัตรา การเสียชีวิตของทารกอุบัติการณ์ของโรคหัวใจและปอด โรคติดต่อทางเพศสัมพันธ์ การตั้งครรภ์ในวัยรุ่น การเสียชีวิตจากยาเสพติดหรือแอลกอฮอล์เพื่อความบันเทิง การบาดเจ็บ และอัตราความพิการ ปัจจัยด้านวิถีชีวิตและสังคมเหล่านี้ทำให้สหรัฐอเมริกาอยู่ในอันดับท้ายสุดของรายการในด้านอายุขัย โดยเฉลี่ยแล้ว ผู้ชายชาวอเมริกันมีอายุขัยเฉลี่ยน้อยกว่าผู้ชายในประเทศที่อยู่ในอันดับสูงสุดเกือบ 4 ปี แม้ว่าชาวอเมริกันที่อายุถึง 75 ปีจะมีอายุยืนยาวกว่าผู้ที่อายุถึง 75 ปีในประเทศอื่นๆ ที่มีฐานะใกล้เคียงกันก็ตาม[ 304 ]ทางเลือกในการบริโภคอย่างหนึ่งที่ก่อให้เกิดโรคภัยไข้เจ็บหลายอย่างที่กล่าวมาข้างต้นคือบุหรี่ ชาวอเมริกันสูบบุหรี่ 258 พันล้านมวนในปี 2016 [ 305 ]บุหรี่ทำให้สหรัฐอเมริกาต้องเสียค่าใช้จ่าย 326 พันล้านดอลลาร์ในแต่ละปีในด้านค่าใช้จ่ายด้านการดูแลสุขภาพโดยตรง (170 พันล้านดอลลาร์ ) และการสูญเสียผลิตภาพ (156 พันล้านดอลลาร์) [ 305 ]
การศึกษาวิจัยอย่างครอบคลุมในปี 2007 โดยแพทย์ชาวยุโรปพบว่า อัตราการรอดชีวิตจากโรคมะเร็งในระยะเวลา 5 ปี ในสหรัฐอเมริกาสูงกว่าในประเทศยุโรปทั้ง 21 ประเทศที่ทำการศึกษาอย่างมีนัยสำคัญ โดยอยู่ที่ 66.3% สำหรับผู้ชาย เทียบกับค่าเฉลี่ยของยุโรปที่ 47.3% และ 62.9% เทียบกับ 52.8% สำหรับผู้หญิง [ 306 ] [ 307 ]ชาวอเมริกันเข้ารับการตรวจคัดกรองมะเร็งในอัตราที่สูงกว่าผู้คนในประเทศพัฒนาแล้วอื่นๆ อย่างมีนัยสำคัญ และเข้าถึง การตรวจ MRIและCT scanในอัตราที่สูงที่สุดในบรรดาประเทศ OECD [ 308 ] ผู้ที่ได้รับการวินิจฉัยว่ามี คอเลสเตอรอลสูงหรือความดันโลหิต สูง ในสหรัฐอเมริกาเข้าถึงการรักษาด้วยยาในอัตราที่สูงกว่าผู้ที่ได้รับการวินิจฉัยในประเทศพัฒนาแล้วอื่นๆ และมีแนวโน้มที่จะควบคุมอาการได้สำเร็จมากกว่า[ 309 ] [ 310 ]ผู้ป่วยเบาหวานมีแนวโน้มที่จะได้รับการรักษาและบรรลุเป้าหมายการรักษาในสหรัฐอเมริกามากกว่าในแคนาดา อังกฤษ หรือสกอตแลนด์[ 311 ] [ 312 ]
จากการศึกษาข้อมูลปี 2016 ของสถาบันการวัดและประเมินสุขภาพ ในปี 2018 พบว่า สหรัฐอเมริกาอยู่ในอันดับที่ 27 ของโลกในด้านการดูแลสุขภาพและการศึกษา ลดลงจากอันดับที่ 6 ในปี 1990 [ 313 ]
ค่าใช้จ่าย
ค่าใช้จ่ายด้านการดูแลสุขภาพของสหรัฐฯ สูงกว่าประเทศอื่นๆ อย่างมากเมื่อพิจารณาจากสัดส่วนของ GDP และมาตรการอื่นๆ ตามข้อมูลของ OECD ค่าใช้จ่ายด้านการดูแลสุขภาพของสหรัฐฯ ในปี 2558 คิดเป็น 16.9% ของ GDP ซึ่งสูงกว่าประเทศที่มีค่าใช้จ่ายสูงรองลงมาใน OECD ถึง 5% [ 314 ]ช่องว่าง 5% ของ GDP คิดเป็น 1 ล้านล้านดอลลาร์ หรือประมาณ 3,000 ดอลลาร์ต่อคน หรือสูงกว่าประเทศที่มีค่าใช้จ่ายสูงรองลงมาถึงหนึ่งในสาม[ 315 ]
ค่าใช้จ่ายด้านการดูแลสุขภาพที่สูงในสหรัฐอเมริกามีสาเหตุมาจากหลายปัจจัย ได้แก่ ความก้าวหน้าทางเทคโนโลยี ค่าใช้จ่ายในการบริหาร การกำหนดราคายา ผู้จำหน่ายที่คิดราคาอุปกรณ์ทางการแพทย์สูงกว่า การได้รับการดูแลทางการแพทย์มากกว่าผู้คนในประเทศอื่น ค่าจ้างแพทย์ที่สูง กฎระเบียบของรัฐบาล ผลกระทบจากการฟ้องร้อง และระบบการชำระเงินของบุคคลที่สามที่ช่วยปกป้องผู้บริโภคจากค่าใช้จ่ายในการรักษาพยาบาลทั้งหมด[ 316 ] [ 317 ] [ 318 ]ราคายา อุปกรณ์ทางการแพทย์ และการจ่ายเงินให้แพทย์ที่ต่ำที่สุดอยู่ในแผนของรัฐบาล ชาวอเมริกันมักได้รับการดูแลทางการแพทย์มากกว่าผู้คนในประเทศอื่น ซึ่งเป็นปัจจัยสำคัญที่ทำให้ค่าใช้จ่ายสูงขึ้น ในสหรัฐอเมริกา บุคคลมีแนวโน้มที่จะได้รับการผ่าตัดหัวใจแบบเปิดหลังจากหัวใจวายมากกว่าในประเทศอื่น Medicaid จ่ายน้อยกว่า Medicare สำหรับยาตามใบสั่งแพทย์หลายชนิด เนื่องจากส่วนลดของ Medicaid กำหนดโดยกฎหมาย ในขณะที่ราคาของ Medicare นั้นเจรจาโดยบริษัทประกันเอกชนและบริษัทยา[ 317 ] [ 319 ]แผนของรัฐบาลมักจะจ่ายน้อยกว่าค่าใช้จ่ายส่วนเกิน ส่งผลให้ผู้ให้บริการด้านการดูแลสุขภาพผลักภาระต้นทุนไปยังผู้ประกันตนเอกชนผ่านราคาที่สูงขึ้น[ 320 ] [ 321 ]
องค์ประกอบของภาคเศรษฐกิจ
ภาคหลัก


การเกษตรในสหรัฐอเมริกาเป็นอุตสาหกรรมหลักของประเทศ ซึ่งเป็นผู้ส่งออกอาหารสุทธิ[ 322 ]จากการสำรวจสำมะโนเกษตร ในปี 2017 พบว่ามีฟาร์ม 2.04 ล้านแห่ง ครอบคลุมพื้นที่ 900 ล้านเอเคอร์ (1,400,000 ตารางไมล์)โดยเฉลี่ย 441 เอเคอร์ (178 เฮกตาร์) ต่อฟาร์ม[ 323 ]
กิจกรรมทางการเกษตรกระจุกตัวอยู่ในหุบเขากลางของแคลิฟอร์เนียและที่ราบใหญ่ ที่ราบใหญ่เป็นพื้นที่ราบกว้างใหญ่ไพศาลที่เหมาะแก่การเพาะปลูกในใจกลางประเทศ ครอบคลุมพื้นที่ทางตะวันตกของทะเลสาบใหญ่และทางตะวันออกของเทือกเขาร็อกกี้ ครึ่งตะวันออกที่มีปริมาณน้ำฝน มากกว่าเป็นแหล่งผลิตข้าวโพดและถั่วเหลืองที่สำคัญ รู้จักกันในชื่อเข็มขัดข้าวโพดและครึ่งตะวันตกที่แห้งแล้งกว่ารู้จักกันในชื่อเข็มขัดข้าวสาลีเนื่องจากมีอัตราการผลิตข้าวสาลีสูง[ 324 ]หุบเขากลางของแคลิฟอร์เนียผลิตผลไม้ผักและถั่วภาคใต้ของอเมริกาเคยเป็นผู้ผลิตฝ้ายยาสูบและข้าว รายใหญ่ แต่การผลิตทางการเกษตรลดลงในช่วงศตวรรษที่ผ่านมาฟลอริดา เป็นผู้นำของประเทศในการผลิตส้มและ เป็น ผู้ผลิตส้มอันดับสองของโลก รอง จาก บราซิลเท่านั้น
สหรัฐอเมริกาเป็นผู้นำด้านการพัฒนาเมล็ดพันธุ์ เช่นการผสมพันธุ์และการขยายการใช้ประโยชน์จากพืชผลทางการเกษตร ตั้งแต่งานของจอร์จ วอชิงตัน คาร์เวอร์ไปจนถึงพลาสติกชีวภาพและเชื้อเพลิงชีวภาพการใช้เครื่องจักรในการทำฟาร์มและการทำฟาร์มแบบเข้มข้นเป็นหัวข้อสำคัญในประวัติศาสตร์ของสหรัฐอเมริการวมถึงไถเหล็กของจอห์น เดียร์เครื่องเกี่ยวข้าวแบบกลไกของไซรัส แมคคอร์มิคเครื่องแยกเมล็ดฝ้ายของอีไล วิทนีย์และความสำเร็จอย่างกว้างขวางของ รถแทรกเตอร์ฟอร์ ดสันและเครื่องเก็บเกี่ยวแบบรวมการเกษตรสมัยใหม่ในสหรัฐอเมริกามีตั้งแต่ฟาร์ม ขนาดเล็กและผู้ผลิตรายย่อยไปจนถึง ฟาร์มเชิงพาณิชย์ขนาดใหญ่ ที่ครอบคลุมพื้นที่เพาะปลูกหรือ ทุ่งหญ้าหลายพันเอเคอร์
ผลิตภัณฑ์ทางการเกษตร ได้แก่ข้าวสาลี ข้าวโพด ธัญพืชอื่นๆผลไม้ ผัก ฝ้ายเนื้อวัว เนื้อหมู สัตว์ปีก ผลิตภัณฑ์นมผลิตภัณฑ์จากป่าและอาหารทะเล


พลังงานในสหรัฐอเมริกาได้มาจากแหล่งต่างๆ มากมาย แม้ว่าส่วนใหญ่มาจากเชื้อเพลิงฟอสซิล ในปี 2023 โดย 38% ของ พลังงานของประเทศมาจากปิโตรเลียม 36% จากก๊าซธรรมชาติและ 9% จากถ่านหินไฟฟ้าจากพลังงานนิวเคลียร์คิดเป็น 9% และพลังงานหมุนเวียนคิดเป็น 9% ซึ่งรวมถึงชีวมวลลมพลังน้ำ พลังงานแสงอาทิตย์และพลังงานความร้อนใต้พิภพ [ 327 ] [ 325 ] การบริโภคพลังงานในปี 2023 ส่วนใหญ่เป็นการใช้ในภาคอุตสาหกรรม (33%) และการขนส่ง (30%) โดยส่วนที่เหลือเป็นการใช้ในบ้าน (20%) และอาคารพาณิชย์ (17%) [ 328 ] [ 329 ]ส่วนของโครงข่ายไฟฟ้าของสหรัฐอเมริกาในทวีปอเมริกาเหนือมีกำลังการผลิตตามป้ายชื่อ 1,280 GW [ 330 ]และผลิตได้ 4,029 TWh [ 331 ]ในปี 2023 โดยใช้พลังงานปฐมภูมิ 34% ในการผลิต[ 332 ]
ก๊าซธรรมชาติแซงหน้าถ่านหินขึ้นเป็นแหล่งพลังงานหลักในการผลิตไฟฟ้าในปี 2016 ถ่านหินถูกแซงหน้าโดยพลังงานนิวเคลียร์เป็นครั้งแรกในปี 2020 และโดยพลังงานหมุนเวียนในปี 2023 [ 331 ]
ค่าพลังงานจะวัดเป็นBTUโดย 1 BTU เท่ากับ 1.055 kJและ 1 ควอดริลเลียน BTU (1 ควอด ) เท่ากับ 1.055 EJ เนื่องจาก BTU เป็นหน่วยของความร้อนแหล่งกำเนิดไฟฟ้าโดยตรงจึงต้องคูณด้วยตัวประกอบการแปลงเพื่อให้เท่ากับแหล่งกำเนิดที่ใช้เครื่องยนต์ความร้อน[ 333 ]
ในปี 2021 สหรัฐอเมริกาเป็นผู้ผลิตและผู้บริโภคพลังงานรายใหญ่เป็นอันดับสองรองจากจีน[ 334 ] สหรัฐอเมริกามีการใช้พลังงานต่อหัว 295 ล้าน BTU (311 GJ) ซึ่งอยู่ในอันดับที่สิบของโลก รองจากแคนาดานอร์เวย์และประเทศอาหรับหลายประเทศ [ 334 ]
เช่นเดียวกับประเทศอื่นๆ เขตเศรษฐกิจพิเศษ (EEZ) ระยะ 200 ไมล์ทะเล (370 กม.) นอกชายฝั่งสหรัฐอเมริกาให้สิทธิพิเศษ แก่ อุตสาหกรรมการประมง[ 335 ]ครอบคลุมพื้นที่ 11.4 ล้านตารางกิโลเมตร (4.38 ล้านตารางไมล์) ซึ่งเป็นเขตที่ใหญ่เป็นอันดับสองของโลก รองจากพื้นที่บนบกของสหรัฐอเมริกา[ 336 ]
ตามข้อมูลของFAOในปี 2548 สหรัฐอเมริกาจับปลา ได้ 4,888,621 ตัน จาก แหล่งประมงธรรมชาติและอีก 471,958 ตันจากการเพาะเลี้ยงสัตว์น้ำทำให้สหรัฐอเมริกาเป็นผู้ผลิตปลารายใหญ่เป็นอันดับ 5 รองจากจีน เปรู อินเดีย และอินโดนีเซีย โดยมีสัดส่วน 3.8 เปอร์เซ็นต์ของปริมาณปลาทั้งหมดทั่วโลก[ 337 ]
การทำเหมืองแร่ในสหรัฐอเมริกาดำเนินมาตั้งแต่สมัยอาณานิคม แต่กลายเป็นอุตสาหกรรมหลักในศตวรรษที่ 19 เนื่องจากการค้นพบแร่ธาตุใหม่จำนวนมากทำให้เกิดการแห่กันไปขุดเหมือง ในปี 2015 มูลค่าของถ่านหิน โลหะ และแร่ธาตุอุตสาหกรรมที่ขุดได้ในสหรัฐอเมริกามีมูลค่า 109.6 พันล้านดอลลาร์สหรัฐ มีคนงาน 158,000 คนที่ได้รับการจ้างงานโดยตรงจาก อุตสาหกรรม เหมืองแร่[ 338 ]
อุตสาหกรรมเหมืองแร่มีผลกระทบหลายประการต่อชุมชน บุคคล และสิ่งแวดล้อม อุบัติเหตุที่เกี่ยวข้องกับความปลอดภัยในเหมืองแร่เป็นส่วนสำคัญของ ประวัติศาสตร์ ความปลอดภัยและสุขภาพในการทำงานของชาว อเมริกัน การทำเหมืองมีผลกระทบต่อสิ่งแวดล้อมหลายประการในสหรัฐอเมริกา ปัญหาต่างๆ เช่นการกำจัดยอดเขาและการระบายน้ำเสียจากเหมืองแร่ที่เป็นกรดมีผลกระทบในวงกว้างต่อสิ่งแวดล้อมทุกส่วน ณ เดือนมกราคม 2020 EPA ได้ระบุเหมืองแร่ 142 แห่งในโครงการSuperfund [ 339 ]
ในปี 2019 ประเทศนี้เป็นผู้ผลิตทองคำ อันดับ 4 ของโลก [ 340 ] ผู้ ผลิต ทองแดงอันดับ 5 ของโลก[ 341 ] ผู้ผลิตแพลทินัม อันดับ 5 ของโลก [ 342 ]ผู้ผลิตเงิน อันดับ 10 ของโลก [ 343 ] ผู้ผลิต รีเนียมอันดับ 2 ของโลก[ 344 ]ผู้ ผลิต กำมะถันอันดับ 2 ของโลก[ 345 ] ผู้ผลิต ฟอสเฟตอันดับ 3 ของโลก[ 346 ] ผู้ผลิต โมลิบเดนัมอันดับ3ของโลก[ 347 ] ผู้ผลิต ตะกั่วอันดับ 4 ของโลก [ 348 ] ผู้ผลิตสังกะสีอันดับ4ของโลก [ 349 ]ผู้ผลิตวานาเดียมอันดับ5 ของโลก [ 350 ] ผู้ผลิต แร่เหล็กอันดับ 9 ของโลก[ 351 ] ผู้ผลิต โพแทสอันดับ9 ของโลก[ 352 ]ผู้ผลิตโคบอลต์ รายใหญ่ที่สุดอันดับ 12 ของโลก [ 353 ]ผู้ผลิตไทเทเนียมราย ใหญ่ที่สุดอันดับ 13 ของ โลก [ 354 ]ผู้ ผลิต ยิปซัมรายใหญ่ที่สุดของโลก[ 355 ] ผู้ผลิต ไคยาไนต์รายใหญ่ที่สุดอันดับ 2 ของโลก[ 356 ]ผู้ผลิตหินปูน รายใหญ่ที่สุดอันดับ 2 ของโลก [ 357 ]นอกจากนี้ยังเป็นผู้ผลิตเกลือ รายใหญ่ที่สุดอันดับ 2 ของโลก อีกด้วย[ 358 ]ในปี 2018 เป็นผู้ผลิตยูเรเนียม รายใหญ่ที่สุดอันดับ 10 ของโลก [ 359 ]


สหรัฐอเมริกาเป็นผู้ผลิตปิโตรเลียม รายใหญ่ที่สุด ในโลก[ 360 ]ปิโตรเลียมเป็นอุตสาหกรรมหลักในสหรัฐอเมริกามาตั้งแต่ การ ค้นพบน้ำมันครั้งใหญ่ในเพนซิลเวเนีย เมื่อปี ค.ศ. 1859 บริเวณเมืองไททัสวิลล์ รัฐเพนซิลเวเนียโดยทั่วไปเรียกกันว่า " บิ๊กออยล์ " อุตสาหกรรมนี้ครอบคลุมการสำรวจการผลิต การกลั่นการขนส่ง และการตลาดผลิตภัณฑ์ น้ำมันและ ก๊าซธรรมชาติ[ 361 ]พื้นที่ผลิตน้ำมันดิบชั้นนำในสหรัฐอเมริกาในปี ค.ศ. 2023 ได้แก่เท็กซัสตามด้วยเขตชายฝั่งของรัฐบาลกลางในอ่าวเม็กซิโกจากนั้นคือรัฐนอร์ทดาโคตาและนิวเม็กซิโก [ 362 ]
ในปี 2023 สหรัฐอเมริกากลายเป็นประเทศผู้ผลิตน้ำมันดิบรายใหญ่ที่สุดในประวัติศาสตร์[ 360 ]การผลิตก๊าซธรรมชาติก็สูงเป็นประวัติการณ์[ 363 ]การจ้างงานในอุตสาหกรรมน้ำมันและก๊าซพุ่งสูงสุดที่ 267,000 คนในเดือนมีนาคม 1982 และมีจำนวนรวม 199,500 คนในเดือนมีนาคม 2024 [ 364 ]
แม้ว่าปิโตรเลียมจะมีประโยชน์มากมายจากการผลิตในปริมาณมาก แต่ก็มีปัญหาที่เกี่ยวข้องกับสิ่งแวดล้อมและสุขภาพของมนุษย์ การรั่วไหลของน้ำมันเป็นแหล่งที่มาของมลพิษ และมีการใช้น้ำปริมาณมากในการผลิตน้ำมัน[ 365 ]การใช้ผลิตภัณฑ์ปิโตรเลียมก่อให้เกิด การ ปล่อย ก๊าซเรือนกระจก
ภาคส่วนรอง
สหรัฐอเมริกาเป็นผู้ผลิตรายใหญ่เป็นอันดับสองของโลก โดยมีผลผลิตทางอุตสาหกรรมในปี 2013 อยู่ที่ 2.4 ล้านล้านดอลลาร์สหรัฐ ผลผลิตทางการผลิตของสหรัฐฯ สูงกว่าของเยอรมนี ฝรั่งเศส อินเดีย และบราซิลรวมกัน[ 366 ] อุตสาหกรรมหลักของสหรัฐฯ ได้แก่ การเงิน เทคโนโลยีสารสนเทศ ปิโตรเลียม เหล็ก รถยนต์ เครื่องจักรกลก่อสร้าง การบินและอวกาศ เครื่องจักรกลการเกษตร โทรคมนาคม เคมีภัณฑ์ อิเล็กทรอนิกส์ การแปรรูปอาหาร สินค้าอุปโภคบริโภค ไม้แปรรูป เหมืองแร่ และอาวุธยุทโธปกรณ์
สหรัฐอเมริกาเป็นผู้นำของโลกในการผลิตเครื่องบิน [ 367 ]ซึ่งคิดเป็นสัดส่วนใหญ่ของผลผลิตทางอุตสาหกรรมของสหรัฐฯ บริษัทอเมริกัน เช่นโบอิ้งเซสนา (ดู: เท็กซ์ตรอน ) ล็อกฮีด มาร์ติน(ดู: สกังก์ เวิร์คส์ ) และเจเนอรัล ไดนามิกส์ผลิตเครื่องบินพลเรือนและเครื่องบินทหารส่วนใหญ่ของโลกในโรงงานต่างๆ ทั่วสหรัฐอเมริกา
ภาคการผลิตของเศรษฐกิจสหรัฐฯ ประสบกับการสูญเสียงานจำนวนมากในช่วงหลายปีที่ผ่านมา[ 368 ] [ 369 ]ในเดือนมกราคม พ.ศ. 2547 จำนวนงานดังกล่าวอยู่ที่ 14.3 ล้านตำแหน่ง ลดลง 3 ล้านตำแหน่ง (17.5%) ตั้งแต่เดือนกรกฎาคม พ.ศ. 2543 และประมาณ 5.2 ล้านตำแหน่งตั้งแต่จุดสูงสุดในประวัติศาสตร์ในปี พ.ศ. 2522 การจ้างงานในภาคการผลิตอยู่ในระดับต่ำที่สุดนับตั้งแต่เดือนกรกฎาคม พ.ศ. 2493 [ 370 ]จำนวนคนงานเหล็ก ลดลงจาก 500,000 คนในปี พ.ศ. 2523 เหลือ 224,000 คนในปี พ.ศ. 2543 [ 371 ]

สหรัฐอเมริกาผลิตสินค้าอุตสาหกรรมประมาณ 18% ของผลผลิตภาคอุตสาหกรรมทั่วโลก ซึ่งเป็นส่วนแบ่งที่ลดลงเนื่องจากประเทศอื่นๆ พัฒนาอุตสาหกรรมการผลิตที่มีศักยภาพในการแข่งขัน[ 373 ]การสูญเสียงานในช่วงที่ปริมาณการผลิตเติบโตอย่างต่อเนื่องนี้เป็นผลมาจากหลายปัจจัย รวมถึงผลิตภาพที่เพิ่มขึ้น การค้า และแนวโน้มทางเศรษฐกิจในระยะยาว[ 374 ]นอกจากนี้ การเติบโตในด้านโทรคมนาคม ยา เครื่องบิน เครื่องจักรกลหนัก และอุตสาหกรรมอื่นๆ ควบคู่ไปกับการลดลงของอุตสาหกรรมระดับล่างและทักษะต่ำ เช่น เสื้อผ้า ของเล่น และการผลิตแบบง่ายๆ อื่นๆ ส่งผลให้งานบางตำแหน่งในสหรัฐอเมริกามีทักษะสูงขึ้นและมีค่าตอบแทนที่ดีขึ้น มีการถกเถียงกันอย่างมากในสหรัฐอเมริกาว่าการลดลงของงานด้านการผลิตนั้นเกี่ยวข้องกับสหภาพแรงงานของอเมริกา ค่าจ้างต่างประเทศที่ต่ำกว่า หรือทั้งสองอย่าง[ 375 ] [ 376 ] [ 377 ]
ภาคบริการ

การขนส่ง
ถนน
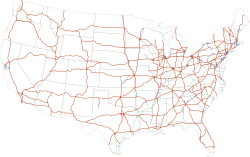
The U.S. economy is heavily dependent on road transport for moving people and goods. Personal transportation is dominated by automobiles, which operate on a network of four million miles (6.4 million km) of public roads,[379] including one of the world's longest highway systems at 57,000 miles (91,700 km).[380] The world's second-largest automobile market,[381] the United States has the highest rate of per-capita vehicle ownership in the world, with 765 vehicles per 1,000 Americans.[382] About 40% of personal vehicles are vans, SUVs, or light trucks.[383]
Rail
Mass transit accounts for 9% of total U.S. work trips.[384][385]Transport of goods by rail is extensive, though relatively low numbers of passengers (approximately 31 million annually) use intercity rail to travel, partially due to the low population density throughout much of the nation.[386][387] However, ridership on Amtrak, the national intercity passenger rail system, grew by almost 37% between 2000 and 2010.[388] Also, light rail development has increased in recent years.[389] The state of California is currently constructing the nation's first high-speed rail system.
Airline


The civil airline industry is entirely privately owned and has been largely deregulated since 1978, while most major airports are publicly owned.[390] The three largest airlines in the world by passengers carried are U.S.-based; American Airlines is number one after its 2013 acquisition by U.S. Airways.[391] Of the world's thirty busiest passenger airports, twelve are in the United States, including the busiest, Hartsfield–Jackson Atlanta International Airport.[392]
Energy

The US is the second-largest energy consumer in total use.[393] The U.S. ranks seventh in energy consumption per capita after Canada and a number of other countries.[394][395] The majority of this energy is derived from fossil fuels: in 2005, it was estimated that 40% of the nation's energy came from petroleum, 23% from coal, and 23% from natural gas. Nuclear power supplied 8.4% and renewable energy supplied 6.8%, which was mainly from hydroelectric dams although other renewables are included.[396]
American dependence on oil imports grew from 24% in 1970 to 65% by the end of 2005.[397]Transportation has the highest consumption rates, accounting for approximately 69% of the oil used in the United States in 2006,[398] and 55% of oil use worldwide as documented in the Hirsch report.
In 2013, the United States imported 2.808 billion barrels of crude oil, compared to 3.377 billion barrels in 2010.[399] While the U.S. is the largest importer of fuel, The Wall Street Journal reported in 2011 that the country was about to become a net fuel exporter for the first time in 62 years. The paper reported expectations that this would continue until 2020.[400] In fact, petroleum was the major export from the country in 2011.[401]
Telecommunications
The Internet was developed in the U.S. and the country hosts many of the world's largest hubs.[402]
Tourism


In the United States, tourism is a large industry that serves millions of international and domestic tourists yearly. Foreigners visit the U.S. to see natural wonders, cities, historic landmarks, and entertainment venues. Americans seek similar attractions, as well as recreation and vacation areas.
Tourism in the United States grew rapidly in the form of urban tourism during the late nineteenth and early twentieth centuries. By the 1850s, tourism in the United States was well established both as a cultural activity and as an industry. New York City, Los Angeles, Chicago, Boston, Philadelphia, Washington, D.C., and San Francisco, all major U.S. cities, have attracted numerous tourists since the 1890s. By 1915, city touring had marked significant shifts in the way Americans perceived, organized, and moved.
During the early 20th century, many more people started to travel, partly because of the spread of the automobile. Similarly air travel revolutionized travel during 1945–1969, contributing greatly to tourism in the United States. Purchases of travel and tourism-related goods and services by international visitors traveling in the United States totaled $10.9 billion during February 2013.[403]
In the U.S., tourism is among the three largest employers in 29 states, employing 7.3 million in 2004, to take care of 1.19 billion trips tourists took in the U.S. in 2005. As of 2007, there are 2,462 registered National Historic Landmarks (NHL) recognized by the United States government. As of 2023, New York City is the most visited destination in the United States, followed by Miami, Los Angeles, Orlando, and San Francisco.[404]
Tourists spend more money in the United States than in any other country, but the United States attracts only the third-highest number of tourists, after France and Spain.[405][406] The discrepancy may be explained by longer stays in the US.[406]
International trade


The U.S. economy plays a significant role in global trade, being the second largest exporter, largest importer and largest services trader as of 2025.[408][409] There is a large amount of U.S. dollars in circulation all around the planet; about 60% of funds used in international trade are U.S. dollars. The dollar is also used as the standard unit of currency in international markets for commodities such as gold and petroleum.[410]
The North American Free Trade Agreement, or NAFTA, created one of the largest trade blocs in the world in 1994.[411][412]
Since 1976, the U.S. has sustained merchandise trade deficits with other nations, and since 1982, current account deficits. The nation's long-standing surplus in its trade in services was maintained, however, and reached a record US$231 billion in 2013.[413]
The U.S. trade deficit increased from $502 billion in 2016 to $552 billion in 2017, an increase of $50 billion or 10%.[414] During 2017, total imports were $2.90 trillion, while exports were $2.35 trillion. The net deficit in goods was $807 billion, while the net surplus in services was $255 billion.[415]
Americas ten largest trading partners are China, Canada, Mexico, Japan, Germany, South Korea, United Kingdom, France, India and Taiwan.[46] The goods trade deficit with China rose from $347 billion in 2016 to $376 billion in 2017, an increase of $30 billion or 8%. In 2017, the U.S. had a goods trade deficit of $71 billion with Mexico and $17 billion with Canada.[416]
According to the KOF index of globalization and the globalization index by A.T. Kearney/Foreign Policy Magazine, the U.S. has a relatively high degree of globalization. U.S. workers send a third of all remittances in the world.[417]
| Balance of trade 2014 (goods only)[418] | |||||||||
|---|---|---|---|---|---|---|---|---|---|
| China | Euro area | Japan | Mexico | Pacific | Canada | Middle East | Latin America | Total by product | |
| Computer | −151.9 | 3.4 | −8.0 | −11.0 | −26.1 | 20.9 | 5.8 | 12.1 | −155.0 |
| Oil, gas, minerals | 1.9 | 6.4 | 2.4 | −20.8 | 1.1 | −79.8 | −45.1 | −15.9 | −149.7 |
| Transportation | 10.9 | −30.9 | −46.2 | −59.5 | −0.5 | −6.1 | 17.1 | 8.8 | −106.3 |
| Apparel | −56.3 | −4.9 | 0.6 | −4.2 | −6.3 | 2.5 | −0.3 | −1.1 | −69.9 |
| Electrical equipment | −35.9 | −2.4 | −4.0 | −8.5 | −3.3 | 10.0 | 1.8 | 2.0 | −40.4 |
| Misc. manufacturing | −35.3 | 4.9 | 2.7 | −2.8 | −1.4 | 5.8 | −1.5 | 1.8 | −25.8 |
| Furniture | −18.3 | −1.2 | 0.0 | −1.6 | −2.1 | 0.4 | 0.2 | 0.0 | −22.6 |
| Machinery | −19.9 | −27.0 | −18.8 | 3.9 | 7.6 | 18.1 | 4.5 | 9.1 | −22.4 |
| Primary metals | −3.1 | 3.1 | −1.8 | 1.0 | 1.9 | −8.9 | −0.9 | −10.4 | −19.1 |
| Fabricated metals | −17.9 | −5.9 | −3.5 | 2.8 | −4.3 | 7.3 | 1.2 | 1.9 | −18.5 |
| Plastics | −15.7 | −1.9 | −2.0 | 5.7 | −4.1 | 2.6 | −0.1 | 0.5 | −15.0 |
| Textile | −12.3 | −1.1 | −0.3 | 2.8 | −4.6 | 1.5 | −0.9 | 0.2 | −14.7 |
| Beverages, tobacco | 1.3 | −9.9 | 0.6 | −3.3 | 0.0 | 1.0 | 0.2 | −0.6 | −10.6 |
| Nonmetallic minerals | −6.1 | −1.9 | −0.4 | −1.2 | 0.1 | 1.9 | −0.5 | −0.8 | −8.9 |
| Paper | −2.7 | 1.2 | 1.1 | 4.3 | 1.2 | −9.8 | 0.9 | −1.9 | −5.8 |
| Chemical | −3.9 | −39.5 | −1.5 | 19.1 | 3.2 | 4.6 | −2.4 | 15.8 | −4.7 |
| Food | 0.7 | −3.6 | 6.1 | 4.9 | 0.9 | 0.1 | 1.4 | −1.1 | 9.5 |
| Agriculture | 17.8 | 6.2 | 7.3 | −3.0 | 5.7 | −0.8 | 2.8 | −6.5 | 29.5 |
| Petroleum | 0.6 | −1.2 | 0.1 | 16.6 | −2.0 | −0.1 | 0.6 | 18.3 | 32.9 |
| Total by country/area | −346.1 | −106.1 | −65.6 | −54.9 | −33.0 | −29.0 | −15.1 | 32.3 | |
Financial position

The U.S. public debt was $909 billion in 1980, an amount equal to 33% of America's gross domestic product (GDP); by 1990, that number had more than tripled to $3.2 trillion – 56% of GDP.[419] In 2001 the national debt was $5.7 trillion; however, the debt-to-GDP ratio remained at 1990 levels.[420] Debt levels rose quickly in the following decade, and on January 28, 2010, the U.S. debt ceiling was raised to $14.3 trillion.[421] Based on the 2010 United States federal budget, total national debt will grow to nearly 100% of GDP, versus a level of approximately 80% in early 2009.[422] The White House estimates that the government's tab for servicing the debt will exceed $700 billion a year in 2019,[423] up from $202 billion in 2009.[424]
U.S. household and non-profit net worth exceeded $100 trillion for the first time in Q1 2018; it has been setting records since Q4 2012.[425] The U.S. federal government or "national debt" was $21.1 trillion in May 2018, just over 100% GDP.[426] Using a subset of the national debt called "debt held by the public", U.S. debt was approximately 77% GDP in 2017. By this measure, the U.S. ranked 43rd highest among 2017 nations.[427] Debt held by the public rose considerably as a result of the Great Recession and its aftermath. It is expected to continue rising as the country ages towards 100% GDP by 2028.[428] In February 2024, the total federal government debt grew to $34.4 trillion after having grown by approximately $1 trillion in both of two separate 100-day periods since the previous June.[429]
The U.S. Treasury statistics indicate that, at the end of 2006, non-US citizens and institutions held 44% of federal debt held by the public.[430] As of 2014, China, holding $1.26 trillion in treasury bonds, is the largest foreign financier of the U.S. public debt.[431]
The overall financial position of the United States as of 2014 includes $269.6 trillion of assets owned by households, businesses, and governments within its borders, representing more than 15.7 times the annual gross domestic product of the United States. Debts owed during this same period amounted to $145.8 trillion, about 8.5 times the annual gross domestic product.[432][433]
Since 2010, the U.S. Treasury has been obtaining negative real interest rates on government debt.[434] Such low rates, outpaced by the inflation rate, occur when the market believes that there are no alternatives with sufficiently low risk, or when popular institutional investments such as insurance companies, pensions, or bond, money market, and balanced mutual funds are required or choose to invest sufficiently large sums in Treasury securities to hedge against risk.[435][436] American economist Lawrence Summers argues that at such low rates, government debt borrowing saves taxpayer money, and improves creditworthiness.[437]
In the late 1940s through the early 1970s, the US and UK both reduced their debt burden by about 30% to 40% of GDP per decade by taking advantage of negative real interest rates, but there is no guarantee that government debt rates will continue to stay so low.[435][438] In January 2012, the U.S. Treasury Borrowing Advisory Committee of the Securities Industry and Financial Markets Association unanimously recommended that government debt be allowed to auction even lower, at negative absolute interest rates.[439]
The consumer confidence index fell to 88.7 in November 2025, which was a significant drop from the previous month. The decrease has been attributed to concerns over employment stability, rising inflation, financial security, trade tensions, and political uncertainty.[440]
Currency and central bank
The United States dollar is the unit of currency of the United States. The U.S. dollar is the currency most used in international transactions.[441] Several countries use it as their official currency, and in many others it is the de facto currency.[442]
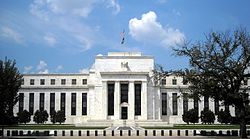
The federal government attempts to use both monetary policy (control of the money supply through mechanisms such as changes in interest rates) and fiscal policy (taxes and spending) to maintain low inflation, high economic growth, and low unemployment. An independent central bank, known as the Federal Reserve, was formed in 1913 to provide a stable currency and monetary policy. The U.S. dollar has been regarded as one of the more stable currencies in the world and many nations back their own currency with U.S. dollar reserves.[43][443]
The U.S. dollar has maintained its position as the world's primary reserve currency, although it is gradually being challenged in that role.[444] Almost two thirds of currency reserves held around the world are held in U.S. dollars, compared to around 25% for the next most popular currency, the euro.[445] Rising U.S. national debt and quantitative easing has caused some to predict that the U.S. dollar will lose its status as the world's reserve currency; however, these predictions have not yet come to fruition.[446]
Climate change

The Fifth National Climate Assessment states that climate change impacts communities over all the territory of the United States. The impacts differ from state to state. The human and economic toll is high. Scientists now can say with relatively high confidence how much climate change impacted a specific meteorological event. The impacts mentioned in the report include, increase in frequency and magnitude of heat waves, droughts, floods, hurricanes and more.[447]
An article in Science predicts that the Southern states, such as Texas, Florida, and the Deep South will be economically affected by climate change more severely than northern states (some of which would even gain benefits), but that economic impacts of climate change would likely exacerbate preexisting economic inequality in the country.[448][449] In September 2020, a subcommittee of the Commodity Futures Trading Commission issued a report that concluded that climate change poses systemic risks to the U.S. financial system,[450][451][452] while the Financial Stability Oversight Council released a report in October 2021 that identified climate change as an emerging and increasing threat to the stability of the U.S. financial system.[453][454][455]
A 2021 survey of 1,422 members of the American Economic Association found that 86 percent of professional economists generally agreed with the statement: "Climate change poses a major risk to the US economy."[456][457] In September 2023, the U.S. Treasury Department issued a report in consultation with the Financial Literacy and Education Commission found that 13% of Americans experienced financial hardship in 2022 due to the effects of climate change after $176 billion in weather disasters.[458][459][460] In April 2024, Consumer Reports announced the release of a report commissioned from ICF International that estimated that climate change could cost Americans born in 2024 nearly $500,000 over their lifetimes.[461][462][463]
A 2026 study published in Nature estimated that, from 1990 through 2020, carbon dioxide emissions in the US caused $10.2 trillion in cumulative damages by 2020, with about 30% occurring within the US itself.[464] The researchers said that future damages from past emissions are at least an order of magnitude larger than historical damages from the same emissions.[464]
Corruption
In 2019, the United States was ranked 23rd on the Transparency InternationalCorruption Perceptions Index with a score of 69 out of 100.[465] This is a decrease from its score in 2018 which was 71 out of 100.[466]
Law and government
The United States ranked 4th in the ease of doing business index in 2012, 18th in the Economic Freedom of the World index by the Fraser Institute in 2012, 10th in the Index of Economic Freedom by The Wall Street Journal and The Heritage Foundation in 2012, 15th in the 2014 Global Enabling Trade Report,[467] and 3rd on the Global Competitiveness Report.[468]
According to the 2014 Index of Economic Freedom, released by The Wall Street Journal and The Heritage Foundation, the U.S. has dropped out of the top ten most economically free countries. The U.S. has been on a steady seven-year economic freedom decline and is the only country to do so.[469] The index measures each nation's commitment to free enterprise on a scale of 0 to 100. Countries losing economic freedom and receiving low index scores are at risk of economic stagnation, high unemployment rates, and diminishing social conditions.[470][471] The 2014 Index of Economic Freedom gave the United States a score of 75.5 and is listed as the twelfth-freest economy in world. It dropped two rankings and its score is half a point lower than in 2013.[469]
Economist Alan Blinder criticizes democratic government regulation of the U.S. economy as too short-sighted (targeting either the next election or the next news cycle rather than making difficult choices that favor long-term benefits despite short-term pain) and favoring policies that sound good and avoiding those that sound bad, regardless of merit when examined rigorously by economists.[472]
Regulations

The U.S. federal government regulates private enterprise in numerous ways. Regulation falls into two general categories.
Some efforts seek, either directly or indirectly, to control prices. Traditionally, the government has sought to create state-regulated monopolies such as electric utilities while allowing prices in the level that would ensure them normal profits. At times, the government has extended economic control to other kinds of industries as well. In the years following the Great Depression, it devised a complex system to stabilize prices for agricultural goods, which tend to fluctuate wildly in response to rapidly changing supply and demand. A number of other industries—trucking and, later, airlines—successfully sought regulation themselves to limit what they considered as harmful price-cutting, a process called regulatory capture.[474]
Another form of economic regulation, antitrust law, seeks to strengthen market forces so that direct regulation is unnecessary. The government—and, sometimes, private parties—have used antitrust law to prohibit practices or mergers that would unduly limit competition.[474]
Bank regulation in the United States is highly fragmented compared to other G10 countries where most countries have only one bank regulator. In the U.S., banking is regulated at both the federal and state level. The U.S. also has one of the most highly regulated banking environments in the world; however, many of the regulations are not soundness related, but are instead focused on privacy, disclosure, fraud prevention, anti-money laundering, anti-terrorism, anti-usury lending, and promoting lending to lower-income segments.
Since the 1970s, government has also exercised control over private companies to achieve social goals, such as improving the public's health and safety or maintaining a healthy environment. For example, the Occupational Safety and Health Administration provides and enforces standards for workplace safety, and the United States Environmental Protection Agency provides standards and regulations to maintain air, water, and land resources. The U.S. Food and Drug Administration regulates what drugs may reach the market, and also provides standards of disclosure for food products.[474]
American attitudes about regulation changed substantially during the final three decades of the 20th century. Beginning in the 1970s, policy makers grew increasingly convinced that economic regulation protected companies at the expense of consumers in industries such as airlines and trucking. At the same time, technological changes spawned new competitors in some industries, such as telecommunications, that once were considered natural monopolies. Both developments led to a succession of laws easing regulation.[474]
While leaders of America's two most influential political parties generally favored economic deregulation during the 1970s, 1980s, and 1990s, there was less agreement concerning regulations designed to achieve social goals. Social regulation had assumed growing importance in the years following the Depression and World War II, and again in the 1960s and 1970s. During the 1980s, the government relaxed labor, consumer and environmental rules based on the idea that such regulation interfered with free enterprise, increased the costs of doing business, and thus contributed to inflation. The response to such changes is mixed; many Americans continued to voice concerns about specific events or trends, prompting the government to issue new regulations in some areas, including environmental protection.[474]
Where legislative channels have been unresponsive, some citizens have turned to the courts to address social issues more quickly. For instance, in the 1990s, individuals, and eventually the government itself, sued tobacco companies over the health risks of cigarette smoking. The 1998 Tobacco Master Settlement Agreement provided states with long-term payments to cover medical costs to treat smoking-related illnesses.[474]
Between 2000 and 2008, economic regulation in the United States saw the most rapid expansion since the early 1970s. The number of new pages in the Federal Registry, a proxy for economic regulation, rose from 64,438 new pages in 2001 to 78,090 in new pages in 2007, a record amount of regulation. Economically significant regulations, defined as regulations which cost more than $100 million a year, increased by 70%. Spending on regulation increased by 62% from $26.4 billion to $42.7 billion.[475]
Taxation


Taxation in the United States is a complex system which may involve payment to at least four different levels of government and many methods of taxation. Taxes are levied by the federal government, by the state governments, and often by local governments, which may include counties, municipalities, township, school districts, and other special-purpose districts, which include fire, utility, and transit districts.[476]
Forms of taxation include taxes on income, property, sales, imports, payroll, estates and gifts, as well as various fees. When taxation by all government levels taken into consideration, the total taxation as percentage of GDP was approximately a quarter of GDP in 2011.[477] Share of black market in the U.S. economy is very low compared to other countries.[478]
Although a federal wealth tax is prohibited by the United States Constitution unless the receipts are distributed to the States by their populations, state and local government property tax amount to a wealth tax on real estate, and because capital gains are taxed on nominal instead of inflation-adjusted profits, the capital gains tax amounts to a wealth tax on the inflation rate.[479]
U.S. taxation is generally progressive, especially at the federal level, and is among the most progressive in the developed world.[480][481][482][483] There is debate over whether taxes should be more or less progressive.[479][484][485][486]
According to the Tax Justice Network in 2022, the US fuels more global financial secrecy than Switzerland, Cayman and Bermuda combined.[487]
Expenditure


The United States public-sector spending amounts to about 38% of GDP (federal is around 21%, state and local the remainder).[489] Each level of government provides many direct services. The federal government, for example, is responsible for national defense, research that often leads to the development of new products, conducts space exploration, and runs numerous programs designed to help workers develop workplace skills and find jobs (including higher education). Government spending has a significant effect on local and regional economies, and on the overall pace of economic activity.
State governments, meanwhile, are responsible for the construction and maintenance of most highways. State, county, or city governments play the leading role in financing and operating public schools. Local governments are primarily responsible for police and fire protection. In 2016, U.S. state and local governments owed $3 trillion and have another $5 trillion in unfunded liabilities.[490]
The welfare system in the United States began in the 1930s, during the Great Depression, with the passage of the New Deal. The welfare system was later expanded in the 1960s through Great Society legislation, which included Medicare, Medicaid, the Older Americans Act and federal education funding.
Overall, federal, state, and local spending accounted for almost 28% of gross domestic product in 1998.[491]
Federal budget and debt
During FY2017, the federal government spent $3.98 trillion on a budget or cash basis, up $128 billion or 3.3% vs. FY2016 spending of $3.85 trillion. Major categories of FY 2017 spending included: Healthcare such as Medicare and Medicaid ($1,077B or 27% of spending), Social Security ($939B or 24%), non-defense discretionary spending used to run federal Departments and Agencies ($610B or 15%), Defense Department ($590B or 15%), and interest ($263B or 7%).[488]
During FY2017, the federal government collected approximately $3.32 trillion in tax revenue, up $48 billion or 1.5% versus FY2016. Primary receipt categories included individual income taxes ($1,587 billion or 48% of total receipts), Social Security/Social Insurance taxes ($1,162 billion or 35%), and corporate taxes ($297 billion or 9%). Other revenue types included excise, estate and gift taxes. FY 2017 revenues were 17.3% of gross domestic product (GDP), versus 17.7% in FY 2016. Tax revenues averaged approximately 17.4% GDP over the 1980–2017 period.[488]
The federal budget deficit (i.e., expenses greater than revenues) was $665 billion in FY2017, versus $585 billion in 2016, an increase of $80 billion or 14%. The budget deficit was 3.5% GDP in 2017, versus 3.2% GDP in 2016. The budget deficit is forecast to rise to $804 billion in FY 2018, due significantly to the Tax Cuts and Jobs Act and other spending bills. An aging country and healthcare inflation are other drivers of deficits and debt over the long-run.[488]
Debt held by the public, a measure of national debt, was approximately $14.7 trillion or 77% of GDP in 2017, ranked the 43rd highest out of 207 countries.[492] This debt, as a percent of GDP, is roughly equivalent to those of many western European nations.[493]
Defense industry
The U.S. defense industry is the world's largest arms industry, valued at over $354 billion in 2026, driven by high-tech investments, geopolitical tensions and modernization efforts. Dominated by major firms like Lockheed Martin, RTX Corporation and Northrop Grumman, the sector is shifting toward autonomous systems, artificial intelligence and software-defined platforms. Key challenges include supply chain constraints, skilled labor shortages and rising regulatory compliance costs.[494]
Business culture
A central feature of the U.S. economy is the economic freedom afforded to the private sector by allowing the private sector to make the majority of economic decisions in determining the direction and scale of what the U.S. economy produces. This is enhanced by relatively low levels of regulation and government involvement,[495] as well as a court system that generally protects property rights and enforces contracts. As of 2025 the United States is home to 36.2 million small businesses, forty percent of the world's millionaires, thirty percent of the world's billionaires, and 138 of the world's 500 largest companies.[496][497][498][499]

From its emergence as an independent nation, the United States has encouraged science and innovation. In the early 20th century, the research developed through informal cooperation between U.S. industry and academia grew rapidly and by the late 1930s exceeded the size of that taking place in Britain (although the quality of U.S. research was not yet on par with British and German research at the time). After World War II, federal spending on defense R&D and antitrust policy played a significant role in U.S. innovation.[500]
The United States is rich in mineral resources and fertile farm soil, and it is fortunate to have a moderate climate. It also has extensive coastlines on both the Atlantic and Pacific Oceans, as well as on the Gulf of Mexico. Rivers flow from far within the continent and the Great Lakes (the five large inland lakes along the Canadian border) provide additional shipping access. These extensive waterways have helped shape the country's economic growth over the years and helped bind America's fifty individual states together in a single economic unit.[501]
The number of workers and, more importantly, their productivity help determine the health of the U.S. economy. Consumer spending in the U.S. rose to about 62% of GDP in 1960, where it stayed until about 1981, and has since risen to 71% in 2013.[72] Throughout its history, the United States has experienced steady growth in the labor force, a phenomenon that is both cause and effect of almost constant economic expansion. Until shortly after World War I, most workers were immigrants from Europe, their immediate descendants, or African Americans who were mostly slaves taken from Africa, or their descendants.[502]
Demographic shift
Beginning in the late 20th century, many Latin Americans immigrated, followed by large numbers of Asians after the removal of nation-origin based immigration quotas.[503] The promise of high wages brings many highly skilled workers from around the world to the United States, as well as millions of undocumented immigrants seeking work in the informal economy. More than 13 million people officially entered the United States during the 1990s alone.[504]

Labor mobility has also been important to the capacity of the American economy to adapt to changing conditions. When labor markets on the East Coast received a major influx of immigrants, many workers moved inland, often to farmland waiting to be tilled. Similarly, economic opportunities in industrial, northern cities attracted Black Americans from southern farms in the first half of the 20th century, in what was known as the Great Migration.
In the United States, the corporation has emerged as an association of owners, known as stockholders, who form a business enterprise governed by a complex set of rules and customs. Brought on by the process of mass production, corporations, such as General Electric, have been instrumental in shaping the United States. Today in the era of globalization, American investors and corporations have influence all over the world. The American government is also included among the major investors in the American economy. Government investments have been directed towards public works of scale (such as from the Hoover Dam), military-industrial contracts, and the financial industry.
Aging
The U.S. population is aging, which has significant economic implications for GDP growth, productivity, innovation, inequality, and national debt, according to several studies. The average worker in 2019 was aged 42, vs. 38 in 2000. By 2030, about 59% of adults over 16 will be in the labor force, vs. 62% in 2015. One study estimated that aging since 2000 has reduced productivity between 0.25% and 0.7% per year. Since GDP growth is a function of productivity (output per worker) and the number of workers, both trends slow the GDP growth rate. Older workers save more, which pushes interests rates down, offsetting some of the GDP growth reduction but reducing the Federal Reserve's ability to address a recession by lowering interest rates. Means of addressing the aging trend include immigration (which may bring in younger workers) and higher fertility rates, which can be encouraged by incentives to have more children (e.g., tax breaks, subsidies, and more generous paid leave).[505]
The Congressional Budget Office estimated in May 2019 that mandatory spending (e.g., Medicare, Medicaid, and Social Security) will continue growing relative to the size of the economy (GDP) as the population ages. The population aged 65 or older is projected to rise by one-third from 2019–2029. Mandatory program spending (outlays) in 2019 were 12.7% of GDP and are projected to average 14.4% GDP from 2025–2029.[506]
Entrepreneurship


The United States has been a leader in technological innovation since the late 19th century and scientific research since the mid-20th century. In 1876, Alexander Graham Bell was awarded the first U.S. patent for the telephone. Thomas Edison's laboratory developed the phonograph, the first long-lasting light bulb, and the first viable movie camera. Edison's company would also pioneer (direct current based) electric power delivery and market it around the world, followed on by companies such as Westinghouse Electric Corporation which would rapidly develop alternating current power delivery. In the early 20th century, the automobile companies of Ransom E. Olds and Henry Ford popularized the assembly line. The Wright brothers, in 1903, made the first sustained and controlled heavier-than-air powered flight.[507]

American society highly emphasizes entrepreneurship and business innovation that facilitates economic dynamism. Entrepreneurship is the act of being an entrepreneur, which can be defined as "one who undertakes innovations, finance and business acumen in an effort to transform innovations into economic goods". This may result in new organizations or may be part of revitalizing mature organizations in response to a perceived opportunity.[508] American entrepreneurs are even engaged in public services delivery through public-private partnerships.
The most obvious form of entrepreneurship refers to the process and engagement of starting new businesses (referred to as startup companies); however, in recent years, the term has been extended to include social and political forms of entrepreneurial activity. When entrepreneurship is describing activities within a firm or large organization it is referred to as intra-preneurship and may include corporate venturing, when large entities spin-off organizations.[508]
According to Paul Reynolds, entrepreneurship scholar and creator of the Global Entrepreneurship Monitor, "by the time they reach their retirement years, half of all working men in the United States probably have a period of self-employment of one or more years; one in four may have engaged in self-employment for six or more years. Participating in a new business creation is a common activity among U.S. workers over the course of their careers."[509] And in recent years, business creation has been documented by scholars such as David Audretsch to be a major driver of economic growth in both the United States and Western Europe.
Venture capital investment

Venture capital, as an industry, originated in the United States, which it still dominates.[510] According to the National Venture Capital Association 11% of private sector jobs come from venture capital backed companies and venture capital backed revenue accounts for 21% of U.S. GDP.[511]
Total U.S. investment in venture capital amounted to $48.3 billion in 2014, for 4,356 deals. This represented "an increase of 61% in dollars and a 4% increase in deals over the prior year", reported the National Venture Capital Association. The Organisation for Economic Cooperation and Development estimates that venture capital investment in the United States had fully recovered by 2014 to pre-recession levels. The National Venture Capital Association has reported that, in 2014, venture capital investment in the life sciences was at its highest level since 2008: in biotechnology, $6.0 billion was invested in 470 deals and, in life sciences overall, $8.6 billion in 789 deals (including biotechnology and medical devices).
Two thirds (68%) of the investment in biotechnology went to first-time/early-stage development deals and the remainder to the expansion stage of development (14%), seed-stage companies (11%) and late-stage companies (7%). However, it was the software industry which invested in the greatest number of deals overall: 1,799, for an investment of $19.8 billion. Second came internet-specific companies, garnering US$11.9 billion in investment through 1,005 deals. Many of these companies are based in the state of California, which alone concentrates 28% of U.S. research.[512]
Some new American businesses raise investments from angel investors (venture capitalists). In 2010 healthcare/medical accounted for the largest share of angel investments, with 30% of total angel investments (vs. 17% in 2009), followed by software (16% vs. 19% in 2007), biotech (15% vs. 8% in 2009), industrial/energy (8% vs. 17% in 2009), retail (5% vs. 8% in 2009) and IT services (5%).[513]
Americans are "venturesome consumers" who are unusually willing to try new products of all sorts, and to pester manufacturers to improve their products.[514]
Mergers and acquisitions
Since 1985 there have been three major waves of mergers and acquisitions in the country. 2017 has been the most active year in terms of number of deals (12,914), whereas 2015 accumulated to the biggest overall value of deals ($24 billion).[515]
The biggest merger deal in U.S. history was the acquisition of Time Warner by America Online Inc. in 2000, where the bid was over $164 billion. Since 2000 acquisitions of U.S. companies by Chinese investors increased by 368%.[515] The other way round—U.S. companies acquiring Chinese Companies—showed a decrease of 25%, with a short upwards trend until 2007.[515]
Research and development

The U.S. invests more funds in research and development (R&D) in absolute terms than the other G7 nations combined: 17.2% more in 2012. Since 2000, gross domestic expenditure on R&D (GERD) in the U.S. has increased by 31.2%, enabling it to maintain its share of GERD among the G7 nations at 54.0% (54.2% in 2000).[512]

Impact of recession on research spending
Generally speaking, U.S. investment in R&D rose with the economy in the first years of the century before receding slightly during the economic recession then rising again as growth resumed. At its peak in 2009, GERD amounted to US$406 billion (2.82% of GDP). Despite the recession, it was still at 2.79% in 2012 and will slide only marginally to 2.73% in 2013, according to provisional data, and should remain at a similar level in 2014.[512]
The federal government is the primary funder of basic research, at 52.6% in 2012; state governments, universities and other non-profits funded 26%. Experimental development, on the other hand, is primarily funded by industry: 76.4% to the federal government's 22.1% in 2012.[512] While U.S. investment in R&D is high, it failed to reach President Obama's target of 3% of GDP by the end of his presidency in 2016. Between 2009 and 2012, the United States' world share of research expenditure receded slightly from 30.5% to 28.1%. Several countries now devote more than 4% of GDP to R&D (Israel, Japan and the Republic of Korea) and others plan to raise their own GERD/GDP ratio to 4% by 2020 (Finland and Sweden).[512]
Business spending on research
Business enterprises contributed 59.1 % of U.S. GERD in 2012, down from 69.0 % in 2000. Private non-profits and foreign entities each contribute a small fraction of total R&D, 3.3% and 3.8%, respectively.[512]

The United States has historically been a leader in business R&D and innovation. The economic recession of 2008–2009 has had a lasting impact, however. While the major performers of R&D largely maintained their commitments, the pain of the U.S. recession was felt mainly by small businesses and start-ups. Statistics released by the U.S. Census Bureau showed that, in 2008, the number of business 'deaths' began overtaking the number of business 'births' and that the trend continued at least through 2012. From 2003 to 2008, business research spending had followed a generally upward trajectory. In 2009, the curve inverted, as expenditure fell by 4% over the previous year then again in 2010, albeit by 1–2% this time. Companies in high-opportunity industries like health care cut back less than those in more mature industries, such as fossil fuels. The largest cutbacks in R&D spending were in agriculture production: −3.5% compared to the average R&D to net sales ratio. The chemicals and allied products industry and electronic equipment industry, on the other hand, showed R&D to net sales ratios that were 3.8% and 4.8% higher than average. Although the amount of R&D spending increased in 2011, it was still below the level of 2008 expenditure. By 2012, the growth rate of business-funded R&D had recovered. Whether this continues will be contingent on the pursuit of economic recovery and growth, levels of federal research funding and the general business climate.[512]
Research spending at the state level
The level of research spending varies considerably from one state to another. Six states (New Mexico, Maryland, Massachusetts, Washington, California and Michigan) each devoted 3.9% or more of their GDP to R&D in 2010, together contributing 42% of national research expenditure. In 2010, more than one quarter of R&D was concentrated in California (28.1%), ahead of Massachusetts (5.7%), New Jersey (5.6%), Washington State (5.5%), Michigan (5.4%), Texas (5.2%), Illinois (4.8%), New York (3.6%) and Pennsylvania (3.5%). Seven states (Arkansas, Nevada, Oklahoma, Louisiana, South Dakota and Wyoming) devoted less than 0.8% of GDP to R&D.[512]


California is home to Silicon Valley, the name given to the area hosting the leading corporations and start-ups in information technology. This state also hosts biotechnology clusters in the San Francisco Bay Area, Los Angeles and San Diego. The main biotechnology clusters outside California are the cities of Boston/Cambridge, Massachusetts, Maryland, suburban Washington, DC, New York, Seattle, Philadelphia, and Chicago. California supplies 13.7% of all jobs in science and engineering across the country, more than any other state. Some 5.7% of Californians are employed in these fields. Route 128 around Boston in the state of Massachusetts is not only home to numerous high-tech firms and corporations but also hosts Harvard University and Massachusetts Institute of Technology.[512]
New Mexico's high research intensity can be explained by the fact that it hosts the Los Alamos National Laboratory. Maryland's position may reflect the concentration of federally funded research institutions there. Washington State has a high concentration of high-tech firms like Microsoft, Amazon and Boeing and the engineering functions of most automobile manufacturers are located in the state of Michigan.[512]
Research spending by multinational corporations
The federal government and most of the 50 states that make up the United States offer tax credits to particular industries and companies to encourage them to engage in research and development (R&D). Congress usually renews a tax credit every few years. According to a survey by The Wall Street Journal in 2012, companies do not factor in these credits when making decisions about investing in R&D, since they cannot rely on these credits being renewed.[512]
In 2014, four U.S. multinational corporations figured in the Top 50 for the volume of expenditure on R&D: Microsoft, Intel, Johnson & Johnson and Google. Several have figured in the Top 20 for at least ten years: Intel, Microsoft, Johnson & Johnson, Pfizer and IBM. Google was included in this table for the first time in 2013.[512]
Global top 50 companies by R&D volume and intensity, 2014 * R&D intensity is defined as R&D expenditure divided by net sales. ** Although incorporated in the Netherlands, Airbus's principal manufacturing facilities are located in France, Germany, Spain and the UK. Source: UNESCO Science Report: towards 2030 (2015), Table 9.3, based on Hernández et al. (2014) EU R&D Scoreboard: the 2014 EU Industrial R&D Investment Scoreboard. European Commission: Brussels, Table 2.2.
Exports of high-tech goods and patents

Until 2010, the United States was a net exporter of pharmaceuticals but, since 2011, it has become a net importer of these goods.
The United States is a post-industrial country. Imports of high-tech products far exceed exports. However, the United States' technologically skilled workforce produces a large volume of patents and can still profit from the license or sale of these patents. Within the United States' scientific industries active in research, 9.1% of products and services are concerned with the licensing of intellectual property rights.[512]
When it comes to trade in intellectual property, the United States remains unrivalled. Income from royalties and licensing amounted to $129.2 billion in 2013, the highest in the world. Japan comes a distant second, with receipts of $31.6 billion in 2013. The United States' payments for use of intellectual property amounted to $39.0 billion in 2013, exceeded only by Ireland ($46.4 billion).[512]
Notable companies and markets

America's largest companies are ranked every year by revenue in the Fortune 500. Between 2000 and 2022's edition of the list, the top spot on the Fortune 500 was occupied by either the auto manufacturer General Motors (GM), the oil and gas giant ExxonMobil, or the retailer Walmart.[517] The US is also home of many of the world's largest companies by market capitalization; As of February 9, 2023, the largest American companies by market cap are Apple, Microsoft, Google (through holding company Alphabet), Amazon, Berkshire Hathaway, Tesla, Nvidia, Visa, ExxonMobil, and Meta Platforms.[518] Moreover, many of these companies are the most valuable brands, with many of the largest companies by revenue and market cap on the annual ranking of most valuable brands by Forbes being joined by Coca-Cola, The Walt Disney Company, and McDonald's.[519]
Some industries within America are defined by a few major companies, often deriving terms such as "Big Three" or "Big Four". Examples of this phenomenon include the Big Three credit reporting agencies (Equifax, Experian, and TransUnion), the Big Three automobile makers (Ford, General Motors, and Stellantis), the Big Four accounting firms (Deloitte, Ernst & Young, KPMG, and PwC), and the Big Four communications carriers (Verizon, AT&T, T-Mobile/Sprint, and Dish Network).[520][521] The American energy industry is among the largest and consists of large companies in oil, natural gas, coal, and renewable energy sources. America's largest energy companies by market are in oil and gas, with ExxonMobil being joined by Chevron, ConocoPhillips, and Schlumberger; British oil companies BP and Shell also have significant presence in the United States and trade on both the London Stock Exchange and New York Stock Exchange. Many large American petroleum companies, as well as BP, can trace some origin back to Standard Oil, a former monopoly run by John D. Rockefeller. In coal, the $30 billion industry is dominated by Peabody Energy, which is the largest coal company in the world with almost $23 billion in revenue for 2021. Much of the nation's coal mining occurs in Wyoming and Appalachian states like West Virginia, Pennsylvania, and Kentucky.[522][523][524]
A 2012 Deloitte report published in STORES magazine indicated that of the world's top 250 largest retailers by retail sales revenue in fiscal year 2010, 32% of those retailers were based in the United States, and those 32% accounted for 41% of the total retail sales revenue of the top 250.[525]

America is the foremost country in the world when it comes to semiconductor production. In 2011, half of the world's 20 largest semiconductor manufacturers by sales were based in America. More recently, Congress under the presidency of Joe Biden passed a bipartisan bill, the CHIPS and Science Act, which bolstered semiconductor production. Some of America's largest semiconductor firms and chip companies are Broadcom, Intel, AMD, and Qualcomm.[526][527][528]
Many of the United States' largest firms by market cap are technology companies. These companies are dominated by the Big Five tech giants (Apple, Amazon, Google, Microsoft, and Meta), though numerous software firms also dominate the American technology industry. These firms range from hardware manufacturers like Dell Technologies, IBM, Hewlett-Packard, and Cisco, to software and computing infrastructure programmers like Oracle, Salesforce, Adobe, and Intuit.[529][530]
In film, American producers create nearly all of the world's highest-grossing films. Many of the world's best-selling music artists are based in the United States. Some of America's largest media companies are The Walt Disney Company, Warner Bros. Discovery, Netflix, Comcast, Paramount Global, and Fox.
Banking and finance

Measured by value of its listed companies' securities, the New York Stock Exchange is more than three times larger than any other stock exchange in the world.[531] As of October 2008, the combined capitalization of all domestic NYSE listed companies was US$10.1 trillion.[532]NASDAQ is another American stock exchange and the world's third-largest exchange after the New York Stock Exchange and Japan's Tokyo Stock Exchange. However, NASDAQ's trade value is larger than Japan's TSE.[531] NASDAQ is the largest electronic screen-basedequity securities trading market in the U.S. With approximately 3,800 companies and corporations, it has more trading volume per hour than any other stock exchange.[533]
Because of the influential role that the U.S. stock market plays in international finance, a New York University study in late 2014 interprets that in the short run, stocks that affect the willingness to bear risk independently of macroeconomic fundamentals explain most of the variation in the U.S. stock market. In the long run, the U.S. stock market is profoundly affected by shocks that reallocate the rewards of a given level of production between workers and shareholders. Productivity shocks, however, play a small role in historical stock market fluctuations at all horizons in the U.S. stock market.[534]
The U.S. finance industry comprised only 10% of total non-farm business profits in 1947, but it grew to 50% by 2010. Over the same period, finance industry income as a proportion of GDP rose from 2.5% to 7.5%, and the finance industry's proportion of all corporate income rose from 10% to 20%. The mean earnings per employee hour in finance relative to all other sectors has closely mirrored the share of total U.S. income earned by the top 1% income earners since 1930. The mean salary in New York City's finance industry rose from $80,000 in 1981 to $360,000 in 2011, while average New York City salaries rose from $40,000 to $70,000. In 1988, there were about 12,500 U.S. banks with less than $300 million in deposits, and about 900 with more deposits, but by 2012, there were only 4,200 banks with less than $300 million in deposits in the U.S., and over 1,800 with more.
Top ten U.S. banks by assets[535][536][537][538]
| 1 | JP Morgan Chase |
| 2 | Bank of America |
| 3 | Citigroup |
| 4 | Wells Fargo |
| 5 | Goldman Sachs |
| 6 | Morgan Stanley |
| 7 | U.S. Bancorp |
| 8 | Bank of NY Mellon |
| 9 | HSBC North American Holdings |
| 10 | Capital One Financial |
A 2012 International Monetary Fund study concluded that the U.S. financial sector has grown so large that it is slowing economic growth. New York University economist Thomas Philippon supported those findings, estimating that the U.S. spends $300 billion too much on financial services per year, and that the sector needs to shrink by 20%. Harvard University and University of Chicago economists agreed, calculating in 2014 that workers in research and development add $5 to the GDP for each dollar they earn, but finance industry workers cause the GDP to shrink by $0.60 for every dollar they are paid.[539] A study by the Bank for International Settlements reached similar conclusions, saying the finance industry impedes economic growth and research and development based industries.[540]
Historical statistics
List of state and territory economies
State and federal district economies
- Economy of Alabama
- Economy of Alaska
- Economy of Arizona
- Economy of Arkansas
- Economy of California
- Economy of Colorado
- Economy of Connecticut
- Economy of Delaware
- Economy of Florida
- Economy of Georgia
- Economy of Hawaii
- Economy of Idaho
- Economy of Illinois
- Economy of Indiana
- Economy of Iowa
- Economy of Kansas
- Economy of Kentucky
- Economy of Louisiana
- Economy of Maine
- Economy of Maryland
- Economy of Massachusetts
- Economy of Michigan
- Economy of Minnesota
- Economy of Mississippi
- Economy of Missouri
- Economy of Montana
- Economy of Nebraska
- Economy of Nevada
- Economy of New Hampshire
- Economy of New Jersey
- Economy of New Mexico
- Economy of New York (state)
- Economy of North Carolina
- Economy of North Dakota
- Economy of Ohio
- Economy of Oklahoma
- Economy of Oregon
- Economy of Pennsylvania
- Economy of Rhode Island
- Economy of South Carolina
- Economy of South Dakota
- Economy of Tennessee
- Economy of Texas
- Economy of Utah
- Economy of Vermont
- Economy of Virginia
- Economy of Washington, D.C.
- Economy of Washington (state)
- Economy of West Virginia
- Economy of Wisconsin
- Economy of Wyoming
Territory economies
- Economy of American Samoa
- Economy of Guam
- Economy of the Northern Mariana Islands
- Economy of Puerto Rico
- Economy of the United States Virgin Islands
See also
- Energy policy of the United States
- Historical Statistics of the United States
- Labor unions in the United States
- Unemployment insurance in the United States
Further reading
 This article incorporates text from a free content work. Licensed under CC BY-SA IGO 3.0. Text taken from UNESCO Science Report: towards 2030, 141–143, UNESCO Publishing.
- Gordon, Robert J. (1986). The American Business Cycle: Continuity and Change. Chicago: University of Chicago Press. ISBN 0-226-30452-3.
สรุปเนื้อหา
ข้อมูลสำคัญจากบทความ
ข้อมูลสำคัญเกี่ยวกับ เศรษฐกิจของสหรัฐอเมริกา
สหรัฐอเมริกามีเศรษฐกิจ แบบตลาด ที่มีการพัฒนา และหลากหลาย สูง [ 38 ] [ 39 ] เป็น เศรษฐกิจที่ใหญ่ที่สุดในโลกเมื่อพิจารณาจาก GDP ตามมูลค่าที่แท้จริง โดย สร้างผลผลิตทางเศรษฐกิจโลกถึง...
ยุคอาณานิคมและศตวรรษที่ 18
ประวัติศาสตร์เศรษฐกิจของสหรัฐอเมริกาเริ่มต้นด้วยการตั้งถิ่นฐานของชาวอังกฤษตาม แนวชายฝั่งตะวันออก ในศตวรรษที่ 17 และ 18 หลังจากปี 1700 สหรัฐอเมริกามีประชากรเพิ่มขึ้นอย่างรวดเร็ว และ การนำเข้า และ การส่งออก ก็เติบโตไปพร้อมกัน แอฟริกา เอเชีย...
ศตวรรษที่ 19
ในระยะเวลา 180 ปี สหรัฐอเมริกาเติบโตขึ้นเป็นเศรษฐกิจขนาดใหญ่ ที่บูรณาการ และ เป็นอุตสาหกรรม ซึ่งคิดเป็นประมาณหนึ่งในห้าของ เศรษฐกิจโลก ในกระบวนการนั้น GDP ต่อหัวของสหรัฐฯ
ศตวรรษที่ 20
ในช่วงต้นศตวรรษ นวัตกรรม ใหม่ และการปรับปรุงนวัตกรรมที่มีอยู่ได้เปิดประตูสู่การพัฒนามาตรฐานการครองชีพของผู้บริโภคชาวอเมริกัน บริษัทหลายแห่งเติบโตขึ้นอย่างมากโดยใช้ประโยชน์จากเศรษฐกิจขนาดใหญ่และการสื่อสารที่ดีขึ้นเพื่อดำเนินงานทั่วประเทศ...